| Configuration Infographic | Overview of Configuration Screens |
|---|
 When applying calculations to data sets displayed in Data-Viewer keep in mind:
-
The Data-Viewer Web Part can display count, sum, average, maximum, or minimum calculated values for columns in parent or nested data sets.
-
You can apply more than one calculation to a data set.
-
If you are using Data Viewer 3.6 or earlier you will need to reset the calculation column(s) if the Column Display Settings screen is accessed after calculations are configured.
NOTE: Resetting the calculation column(s) is not required if you are using Data-Viewer 3.7. To find out what version you are using, click here
To configure Data-Viewer to display calculations:
 1. Click the Calculations button under the Data Analysis header in the Data-Viewer configuration screen.
NOTE:
This step requires you to have accessed the Data-Viewer Settings screens by clicking the Data Viewer Web Part Settings button in the web parts configuration tool pane.
2. Define your calculation using the provided tool, shown below.
| # | Function |
|---|---|
 |
|
| 1. |
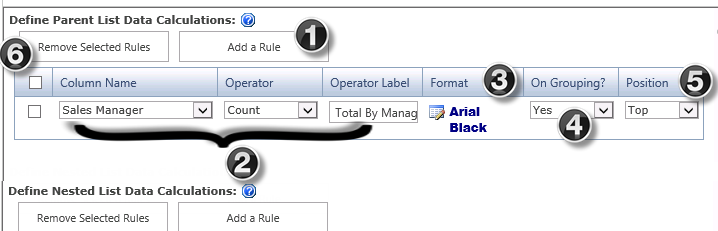
Click the Add a Rule button for the list you want to analyze (parent or nested).
|
| 2. |
Use the following parameters to build the calculation rule:
|
| 3. |
|
| 4. |
|
| 5. |
Select where you would like to position the calculation results in the data view. You can display results above the data set, below it, or both.
|
| 6. | To remove a calculation, select the check box for the desired rule and click the Remove Selected Rules button. |
|
Result: 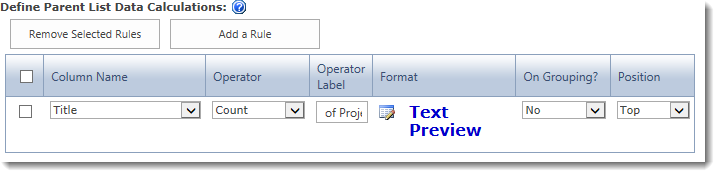 …will look like this in the Data-Viewer display. 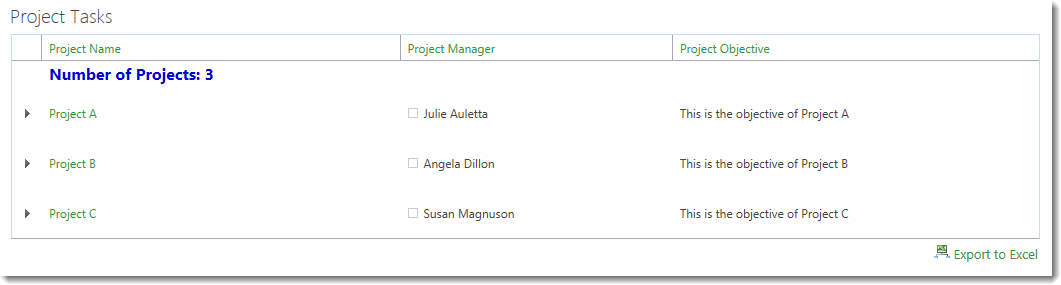
|
|
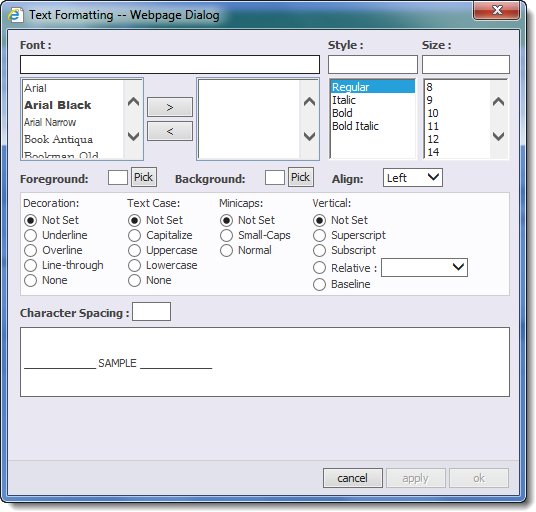 Click the edit icon (
 ) in the Format column to access the Text formatting pop-up.
 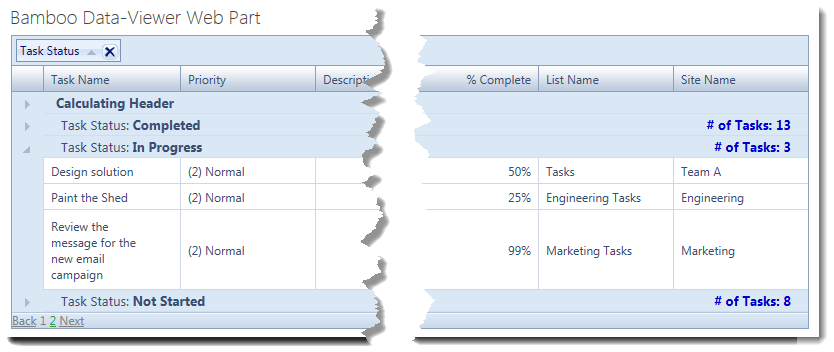 Select Yes in the On Grouping? drop down if you want the calculation result and the Operator Label to appear in the group headers.
 | Configuration Infographic | Overview of Configuration Screens |
|---|
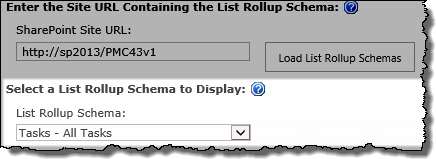
 Bamboo List Rollup is one of the four available data sources for Data-Viewer.
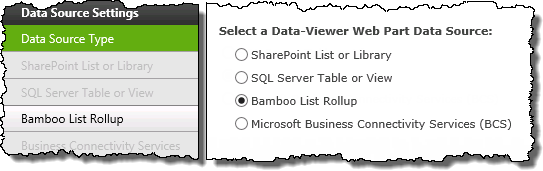
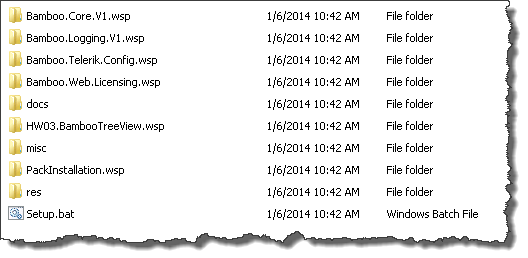 When you extract the product EXE to a location on your SharePoint server, several folders are created that contain installation files and Setup program configuration files. The root level of the extracted file system includes the file Setup.bat, which launches the Setup program. The list below shows the installation files for the Tree View Web Part, as an example.
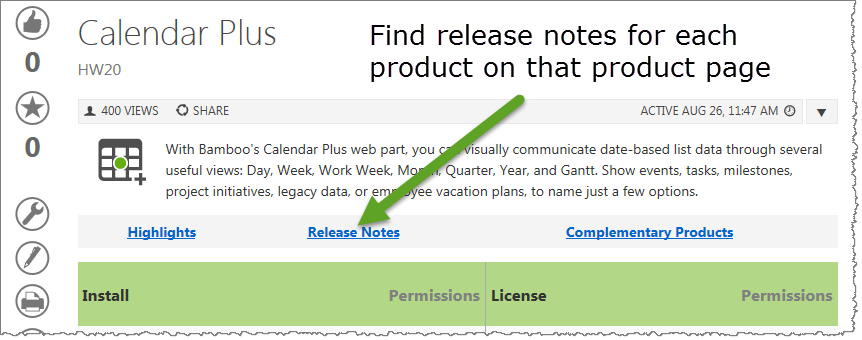 As you look at each product’s documentation page, you will see there is a link to the Release Notes for that product at the top of the page.