How to Populate Data in the Project Portfolio Dashboard
Most organizations have separate sites for each of their projects, but at the very least, they maintain separate summary lists, task lists, issues lists, etc. for each project whether it is on separate sites within a site collection, or just Web Part Pages within a site.
To have your Project Summary List feed Project Portfolio Dashboard automatically, just follow these steps:
| Step |
Action |
| 1. |
Just add the Bamboo Project Dashboard Data Mapping Web Part to the same page where your Project Portfolio Dashboard is or add it to another page within the same site or site collection. |
| 2. |
Review the data in your Project Summary List and determine whether you want to add more choices to the Choice columns in the Project Portfolio Dashboard List so that they are available to you when you are mapping the choice values from your Project Summary List to the choice values in the mapped Project Portfolio Dashboard column.
For instance, if you have a Project Status column in the your Project Summary List where one of the statuses is “Open”, then you can modify the Project Status column in the Project Portfolio Dashboard List to add the “Open” status so you can map it directly or you can choose to just map the “Open” status to an already existing status in the Project Portfolio Dashboard List.
|
| 3. |
Configure the Bamboo Project Dashboard Data Mapping Web Part. |
|
See Configuring the Bamboo Project Dashboard Data Mapping Web Part. You can choose to configure mappings individually for each Project Summary, or configure a single mapping to auto discover similar lists (i.e. Lists with the same name or Lists of the same type, like Tasks, Project Tasks, etc.) within or at the same level as the configured site.
Create a Single Project Dashboard
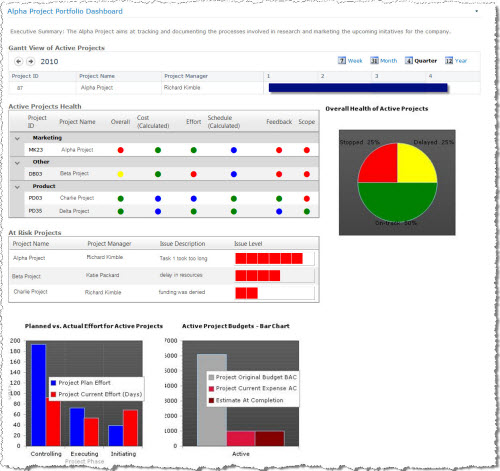
Project Portfolio Dashboard provides a complete picture of a single project from a variety of perspectives, including schedule, budget, risk and issues.
Each of these perspectives is communicated using chart widgets, red/yellow/green indicator widgets and a Gantt widget. The project manager can list the executive summary at the top of the dashboard and pick and choose the widgets used to display the project data. To the right is an example of how a single project dashboard may look.
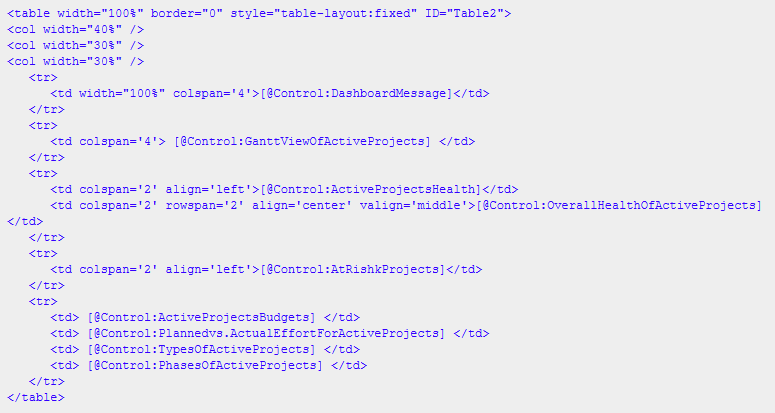
Below is the Single Project Portfolio Dashboard layout HTML for this example (see Configuring Project Portfolio Dashboard Layout for more information).
Create a Multi Project Dashboard
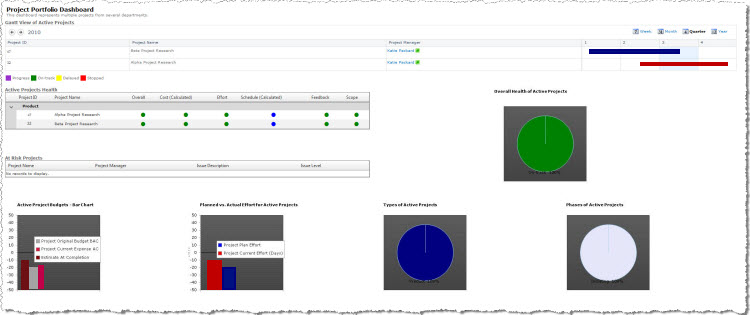
Project Portfolio Dashboard is designed to be used for communicating the status, health, risk and progress of a portfolio of projects. It may be used by individuals who are managing several projects or by a department manager whose team has multiple projects. In either case, the project manager can add as much or as little information as needed. Here is an example of how Project Portfolio Dashboard may look.
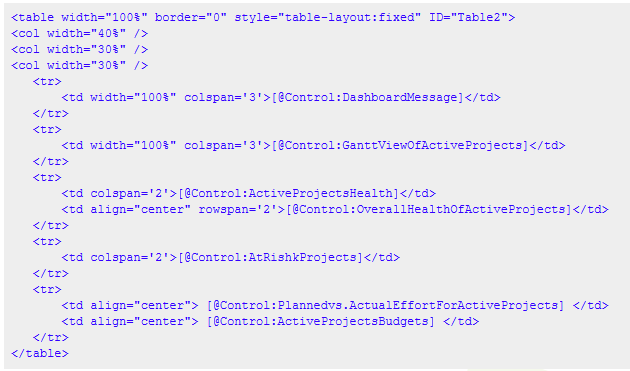
The Project Portfolio layout HTML for this example looks like this (see Configuring Project Portfolio Dashboard Layout for more information):