Chart Plus allows you to easily create powerful charts in SharePoint from SharePoint Lists & Libraries, SQL Server Tables or View, Bamboo List Rollup, BCS and Excel Services.
Use the walkthrough below to set up your chart: Data Source, Chart Type & Configuration, Display Settings, and User Interaction.
The minimum required settings are configuring a data source, selecting a chart type, and configuring the Chart Options tab. All other settings are optional.
Select a Data Source
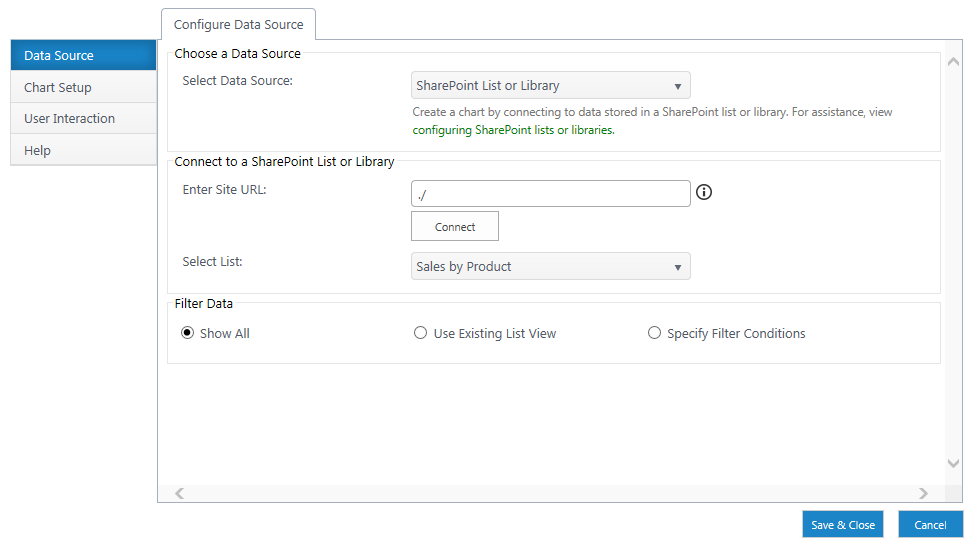
Choose & configure a data source for your chart. Set up any data filters at the source level.
- SharePoint List or Library
- SQL Server Database
- List Rollup
- Business Connectivity Services
- Excel Services
Choose a Chart & Configure Chart Setup
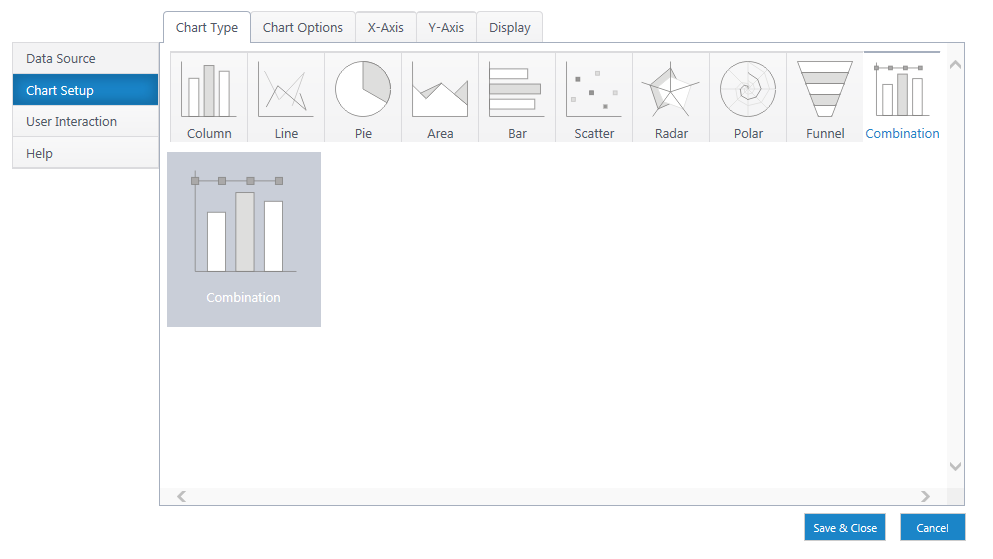
Under Chart Setup in the left menu, select your chart type from the Chart Type tab. Click on the links below for details using & configuring each.
Configure Display Settings
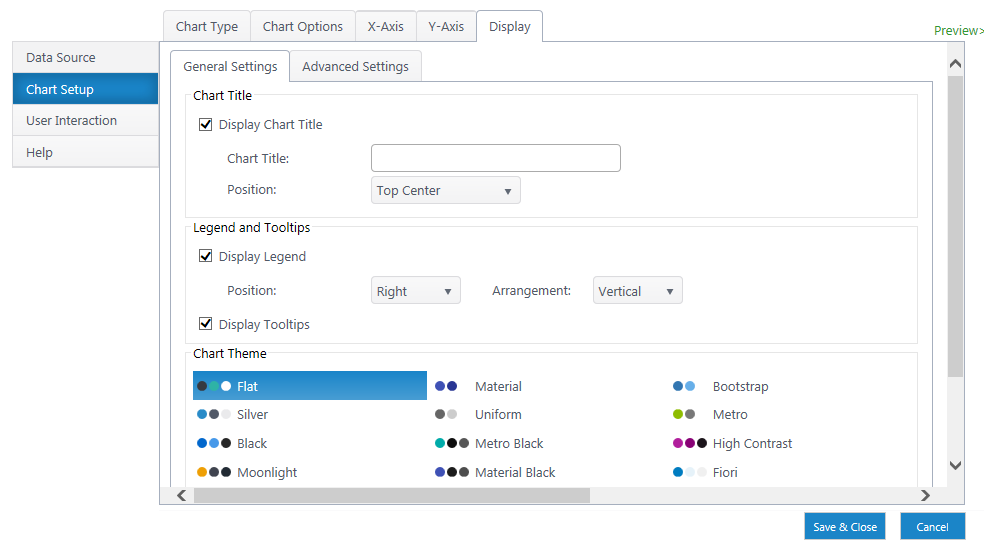
Read Configuring Display Settings for a detailed walkthrough on configuring the Display tab under the Chart Setup menu.
Here, you can name the chart title, configure legends & tooltips, and customize virtually every visual aspect of the chart.
Configure User Interaction
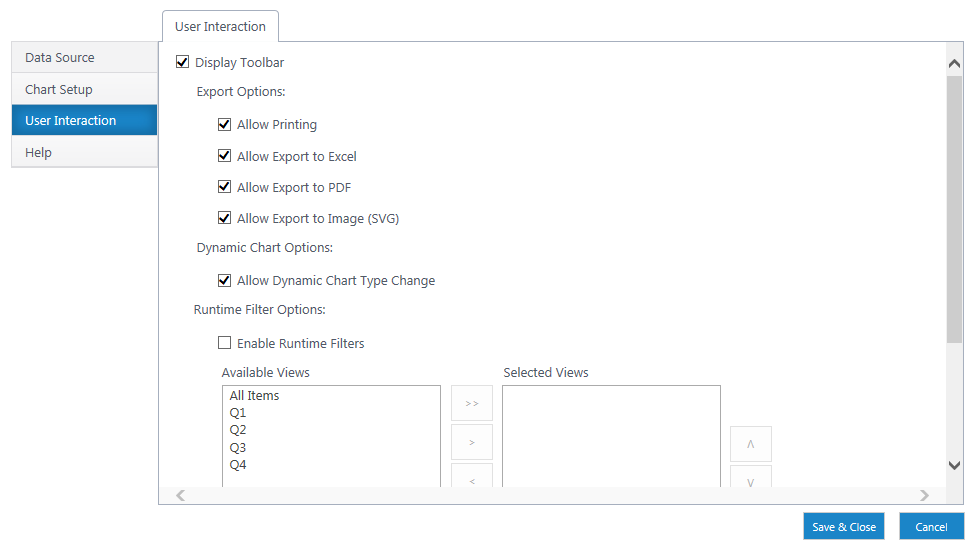
Read Configure User Interaction for information on configuring how users interact with charts. Here you can toggle toolbars, sharing, and runtime filters.