| Configuration Infographic | Overview of Configuration Screens |
|---|
 When applying calculations to data sets displayed in Data-Viewer keep in mind:
-
The Data-Viewer Web Part can display count, sum, average, maximum, or minimum calculated values for columns in parent or nested data sets.
-
You can apply more than one calculation to a data set.
-
If you are using Data Viewer 3.6 or earlier you will need to reset the calculation column(s) if the Column Display Settings screen is accessed after calculations are configured.
NOTE: Resetting the calculation column(s) is not required if you are using Data-Viewer 3.7. To find out what version you are using, click here
To configure Data-Viewer to display calculations:
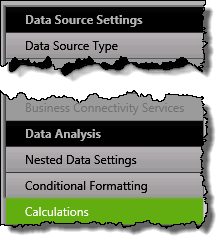
 1. Click the Calculations button under the Data Analysis header in the Data-Viewer configuration screen.
NOTE:
This step requires you to have accessed the Data-Viewer Settings screens by clicking the Data Viewer Web Part Settings button in the web parts configuration tool pane.
2. Define your calculation using the provided tool, shown below.
| # | Function |
|---|---|
 |
|
| 1. |
Click the Add a Rule button for the list you want to analyze (parent or nested).
|
| 2. |
Use the following parameters to build the calculation rule:
|
| 3. |
|
| 4. |
|
| 5. |
Select where you would like to position the calculation results in the data view. You can display results above the data set, below it, or both.
|
| 6. | To remove a calculation, select the check box for the desired rule and click the Remove Selected Rules button. |
|
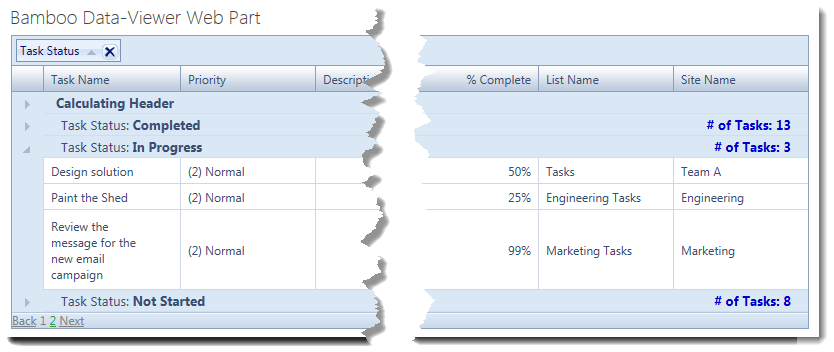
Result:  …will look like this in the Data-Viewer display. 
|
|
| Configuration Infographic | Overview of Configuration Screens |
|---|
 Click the edit icon (
 Select Yes in the On Grouping? drop down if you want the calculation result and the Operator Label to appear in the group headers.