Charts can be displayed vertically (X-axis on the bottom) or horizontally (X-axis on the left).
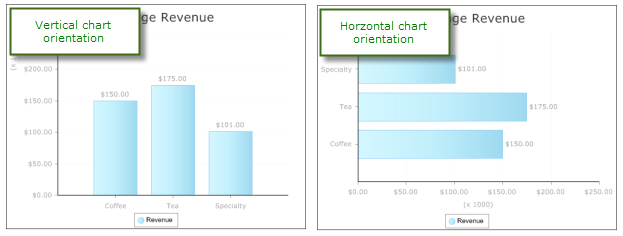
The chart on the left is in a vertical orientation while the example on the right is showing a horizontal orientation.

See also:
Bamboo Solutions
Product Documentation

Charts can be displayed vertically (X-axis on the bottom) or horizontally (X-axis on the left).
The chart on the left is in a vertical orientation while the example on the right is showing a horizontal orientation.

See also: