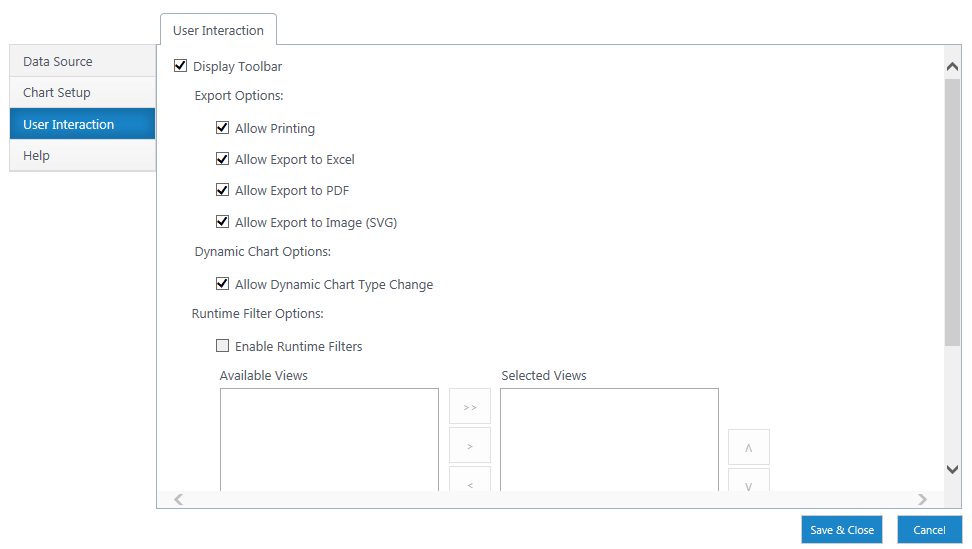
User Interaction settings are found under the User Interaction tab on the left. Here you can toggle the toolbar, export, chart change, runtime filter, and chart selection options.
Toggle Display Toolbar
- Display Toolbar – Toggle the toolbar that displays the options below for dynamic chart types, exporting, and runtime filters. Turning the toolbar off will make these features unavailable.
Export Options

Configure options for exporting your chart. This only exports the chart, not the data table.
- Allow Printing
- Allow Export to Excel
- Allow Export to PDF
- Allow Export to Image (SVG)
Dynamic Chart Options
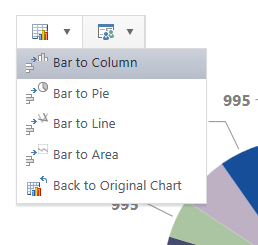
Dynamic Chart Type Change allows users to change the chart type on the fly from the toolbar. This is helpful for comparing data in different ways.
Available chart types will depend on the dataset. 100% chart types will behave differently, but here are some general guidelines:
- Standard Column, Pie, Line, and Area charts are interchangeable.
- Scatter and Polar charts are interchangeable.
- Funnel charts can convert to column, pie, line, and area.
- Bar charts convert to column, pie, line, and area
- Combination charts do not support dynamic type change.
Runtime Filter Options
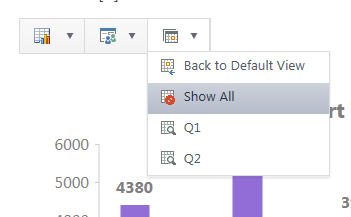
Toggle Runtime Filters, which allow users to filter on the fly with views you configure. Use the arrows to move views into the runtime filter options and to re-order them.
Chart Selection Options
Enable or disable Navigate to Data Source here. If on, clicking on a chart element will open the source page in a new tab.