Display settings are found under Chart Setup > Display > General Settings. Use the Advanced Settings tab to configure deeper styling details for the canvas, axes, and legends and to add custom CSS.
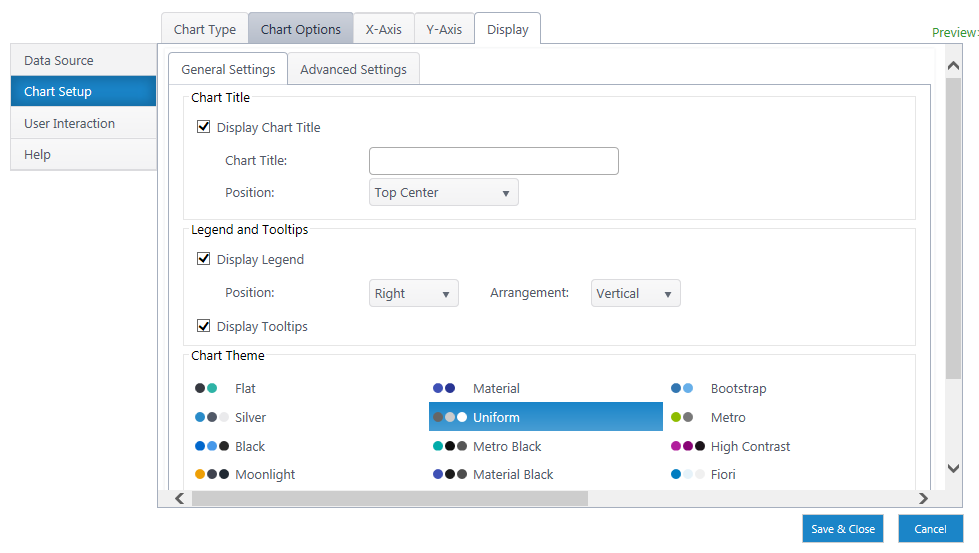
Chart Title
- Display Chart Title – Toggle display of chart title and customize the title name & position on the canvas.
Legend & Tooltips
-
Display Legend – Toggle legend display.
-
Position & Arrangement – Toggle where the legend is placed on canvas and how the items in the legend are arranged (vertically or horizontally listed).
-
Display Tooltips – Toggle tooltips, which display additional data when users hover over an item on the chart.
Chart Theme
Choose a set of colors from a list of pre-set themes. For additional customization, see the Advanced Settings tab.
Series Color
Customize the color of each series using the arrow buttons. You can use either hex codes or the color picker. These automatically update when you choose a theme. If you change these after choosing a theme, you override the series color defaults for that theme.
Advanced Settings Tab
The advanced settings tab allows granular control over colors, fonts, and borders for the chart area, legend, and axes.
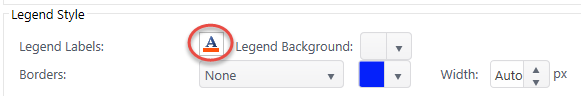
Click on the A icon, the font editor, to open the settings menu. Adjust colors and border settings using the dropdowns.
You can also add custom CSS here.
Chart Series Line Properties
For Line Charts, you can configure the Line type (solid, dotted, etc.) and width in pixels.