Chart Plus Cloud allows you to easily create powerful charts on Office 365 pages. When you have a pre-existing dataset which can be pulled from, you are able to use this information to create different charts as needed.
If you do not have a dataset already, please see this article about setting up a new dataset.
Contents
Set Up
- Firstly, navigate to the page where you would like to have your chart placed.
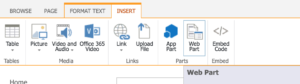
- Next, click on Insert and then Web Part from the title bar.
- This will open the list of parts belonging to your organization.
- Select the Chart Plus app that you want from the list and click on Add. If there is no satisfactory Chart Plus app, you may need to create one.
- At this point, a new Chart Plus instance with the dataset that was specified when the object was first created. If you need to make any changes to this particular instance, read on; you will be able to add, remove, and edit the items on the list.
Editing Items
Method 1 – Works for Any Edits
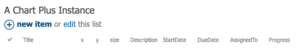
- Click on the edit link located at the top of your Chart Plus instance.
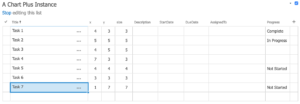
- This will make your whole instance editable.
- Change or add any rows in the instance. When you would like to save your changes, click on the Stop link to stop editing the instance.
Method 2 – Only for Adding
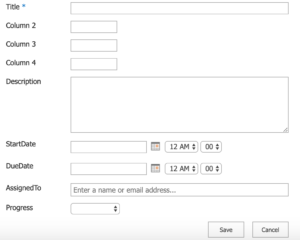
- Click on the the new item link located at the top of your Chart Plus instance.
- This will bring you to the New Item page.
- Fill in the information for each column (as needed). When finished, click on Save.
- At this point, your new item will have been inserted into the instance.