| Configuring Chart Plus |
|---|
Create charts from data in SharePoint lists, SQL Server tables or views, MashPoint or Microsoft Business Data Catalog applications, or data views created by Bamboo List Rollup Web Part. Update source data and watch your charts update in real-time! Read data from an Excel Workbook to generate charts using Excel Services, from SQL tables from another server using secure store account, and from external lists with External Content Type based on a SQL Server Table.
Click on a category name below for details about the options available in the Data Connection Settings section of the Web Part Settings. To edit Chart Plus Web Part Settings, edit the Web Part properties and click the Chart Plus Web Part Settings button in the Web Part tool pane.
Tip: Click the Preview button to preview the chart after changing a setting.
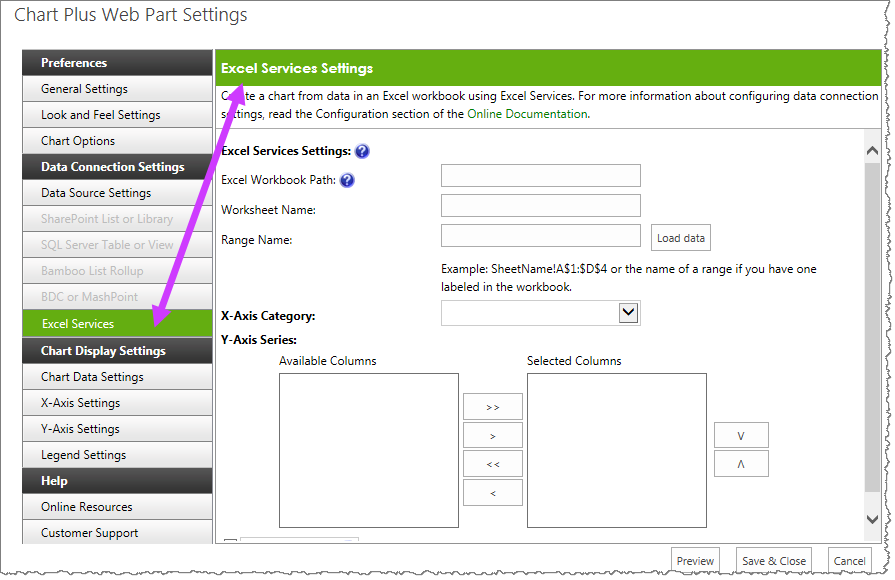
 When you choose the Data Source Type, the link for that type on the left side of the Chart Plus Web Part Settings dialog is enabled. The corresponding options display so that you may configure the appropriate options for that data source type.
For example, in this image, the Excel Services option is selected; therefore, the options corresponding to Excel Services are then shown in the configuration panel.
SharePoint List or Library

Use a SharePoint List or Library as the Data-Viewer data source. Regardless of the SharePoint on-premises version, display data from a SharePoint List or Library.
SQL Table or View
 Display data from a Microsoft SQL Server 2005 or SQL Server 2008 table or view.
Bamboo List Rollup
 To display data from more than one list or library in a Data-Viewer Web Part, connect to a Bamboo List Rollup – sold separately. List Rollup Web Part aggregates data from multiple lists or libraries into a single view, which can then be displayed in a Data-Viewer Web Part to take advantage of data analysis and data interaction features. For product and purchasing information for List Rollup Web Part, visit the product page.
For details about configuring List Rollup Web Part to aggregate data, view the List Rollup Online Documentation.
Excel Services
 To create a chart using data stored in an Excel workbook, configure the connection options as instructed here.
BDC or MashPoint
Display data from external applications using Business Data Connectivity or MashPoint. To create a chart using data stored in a BDC or MashPoint application, follow instructions here.
External List
Lastly, we also offer you the ability to create a chart, in Chart Plus 3.5 for SharePoint 2010, using data stored in an External List. In order to create an External List, you must first create an External Content Type using the instructions found in the topic: How to Use an External List.
| Configuring Chart Plus |
|---|