Changing a Charts Orientation
Though Column and Bar charts are similar in many ways, there are many differences between them.
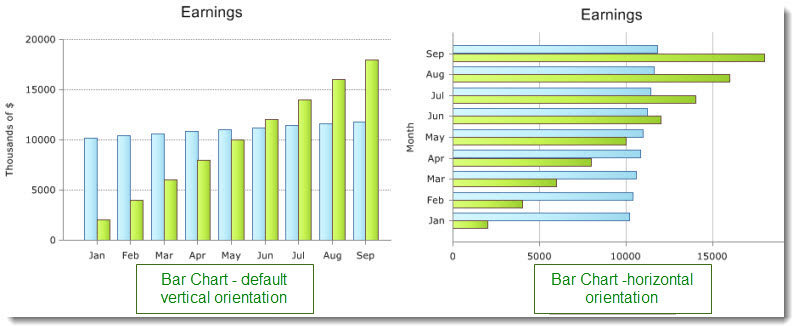
Both use rectangles to compare items based on proportional length, but, where one chart depicts information using vertical rectangles, the other depicts the same information using horizontal rectangles. This may not seem like a big difference, but the orientation of a chart can influence how the data will be interpreted.
In Chart Plus 3.0 and higher, you can change the orientation of your chart with a simple setting, allowing you to easily determine which presentation works best with your dataset.

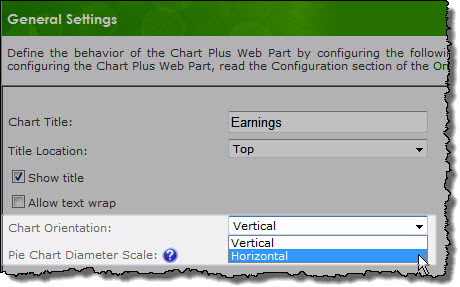
The default orientation of a chart can be changed in the General Settings configuration screen using the Chart Orientation drop-down list. This option is available for all chart types except Pie and Bubble charts.

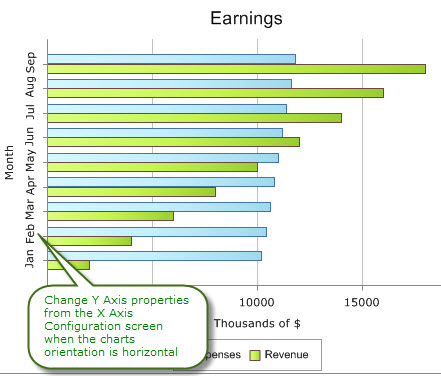
Note: When you change the chart orientation, the X and Y axes will flip on the chart, but the X -Axis and Y-Axis configuration screens will still assume a vertical orientation.
For example: To make further changes to the Y-Axis of a chart configured with a horizontal orientation, the changes should be made to the X-Axis settings screen.
