The Chart Plus Web Part will allow you to chart both Grouped and Ungrouped data.
Grouped Data
A Grouped version of data organizes the individual items into groups.

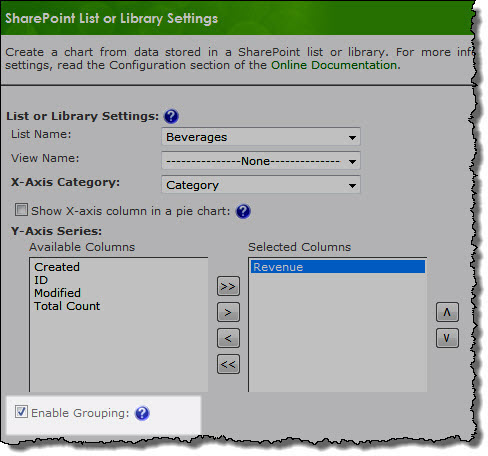
By default the Enable Grouping check box is selected on the SharePoint List or Library Settings screen.
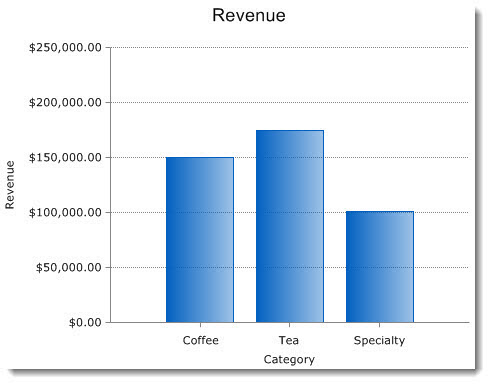
Here is an example of a chart where Revenue is grouped by Category.
Ungrouped Data
Ungrouped data refers to data that contains common elements but is not further organized.
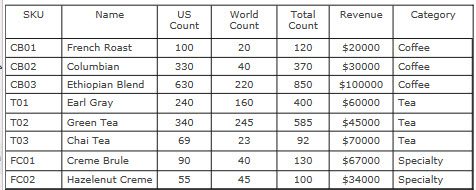
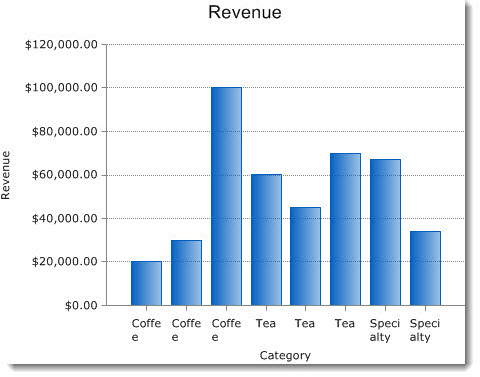
Deselecting the Enable Grouping box will create a chart where there is a data series for each X-Axis category.
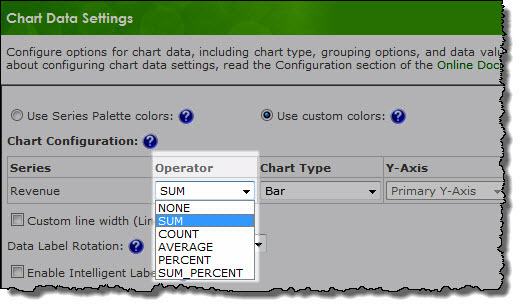
When you are working with Grouped Data, the Chart Plus Web Part will give you the option to perform additional calculations on series data. Simply select the appropriate Operator from the available drop-down list on the Chart Data Settings screen.
