 The color scheme configuration options available in Chart Plus 3.0 ensure that the charts you create will be visually impressive. Chart Plus provides two options for applying color to your charts; you can use one of the predefined Series Palettes, or create your own Custom Palette.
Default series palette
The Default series palette associated with Chart Plus uses the blue and green color scheme shown here.
| Step | Action | Result |
| 1. | To change the Series Palette go to the Look and Feel Settings screen and select one of the 23 other Windows-based themes available in the Series Palette drop down list. | 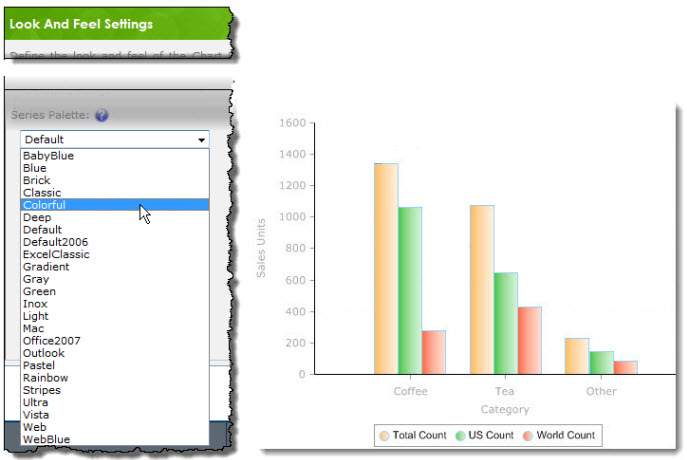 |
| Step | Action | Result |
| 1. |
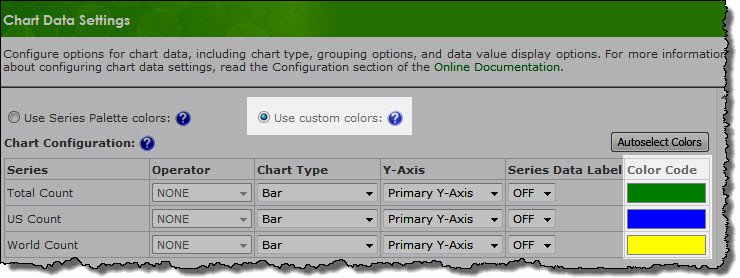
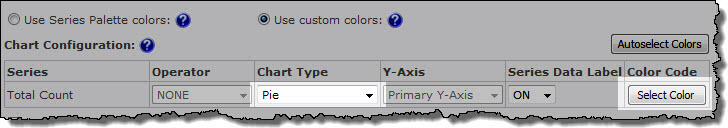
If you want even more flexibility in determining the color palette of the chart, click the Use custom colors radio button found on the Chart Data Settings screen. Use Autoselect Colors to have Chart Plus randomly assign series colors or choose colors from the Bamboo Color Picker by clicking the color bar next to the series. |
|