Sometimes, the most effective way to share information will be to display multiple sets of data on the same chart. Chart Plus makes creating charts with multiple Y-axis series simple.
| Step | Action | Result |
| 1. | To plot multiple series on a chart, choose the Y-Axis Series from the Available Columns using the > or >> buttons to add them to Selected Columns. | 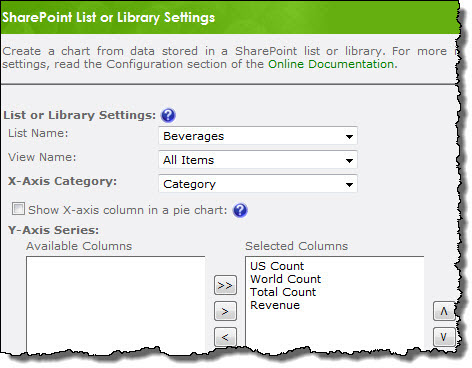 |
| 2. | On the Chart Data Settings screen, select the Operator, Chart Type, and Y- Axis that will be used to display each series. When displaying multiple series you may want to consider using a Secondary Y-Axis so you can plot the series against different units of measure. | 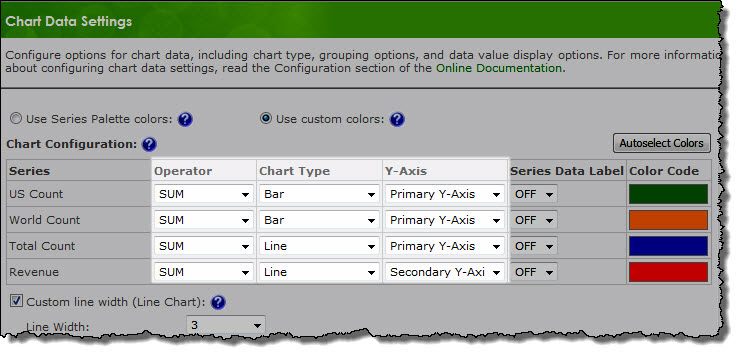 |
| 3. | The Secondary Y Axis value type and range are configured on the same Y-Axis Settings screen used for the Primary Y-Axis. | 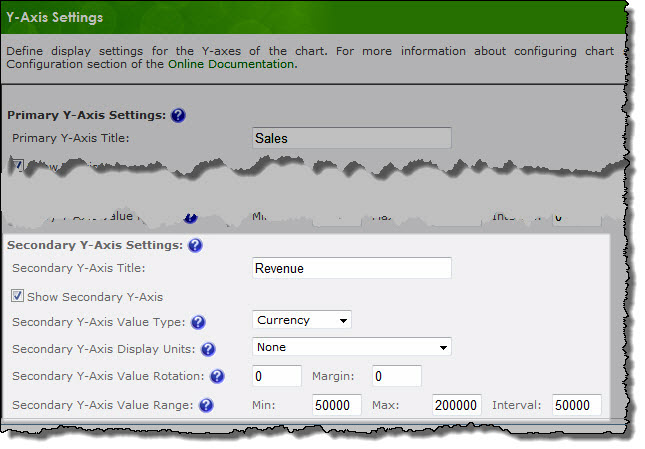 |
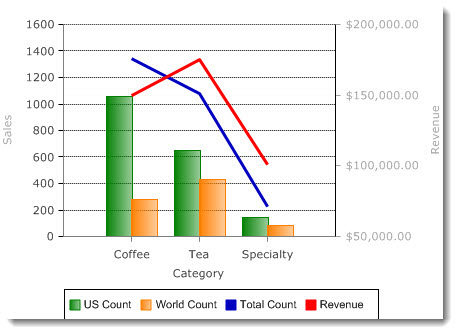
| 4. | After applying the custom settings, the chart will look like this: |
|