 If your company has data in a legacy database, there may be situations where you need to expose that data graphically in SharePoint. Chart Plus will not only display data from a SharePoint List or Library, it will also chart data from other sources, including a SQL server table or view.
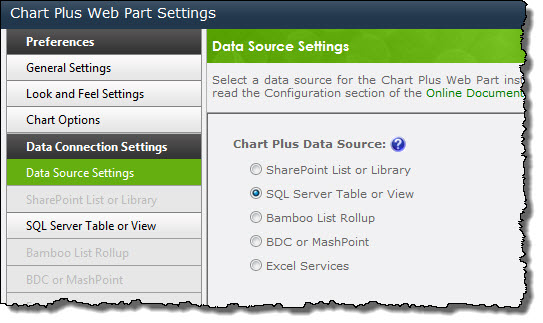
When SQL is selected as your Chart Plus Data Source, the SQL Server Table or View screen will be available under Data Connection Settings.
To create a connection to the SQL server, you will need to follow these steps:
| Step | Action | Result |
| 1. | Enter the name of the SQL Server. |
Only select this option if SQL Server and SharePoint are on the same server, as is the case with a standalone SharePoint installation. To access a SQL Server database on a different server, use the Input an account option.
|
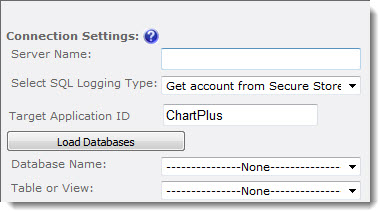
| 2. | Enter ChartPlus in Target Application ID. Click the Load Databases button to populate the list of databases available on the SQL Server, and then make chart data source selections: |
|
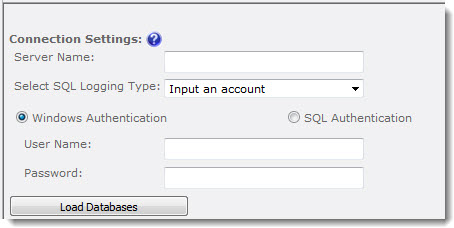
| 3. | Enter the credentials for the access account. This account will need to have access to the SQL data you want to expose through Chart Plus. | |
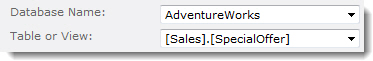
| 4. | Select the source database from the Database drop-down list of accessible options. | |
| 5. | Choose your desired Table or View. | |
| 6. | Determine which columns will be displayed on the X-Axis Category and Y-Axis Series of the chart. | 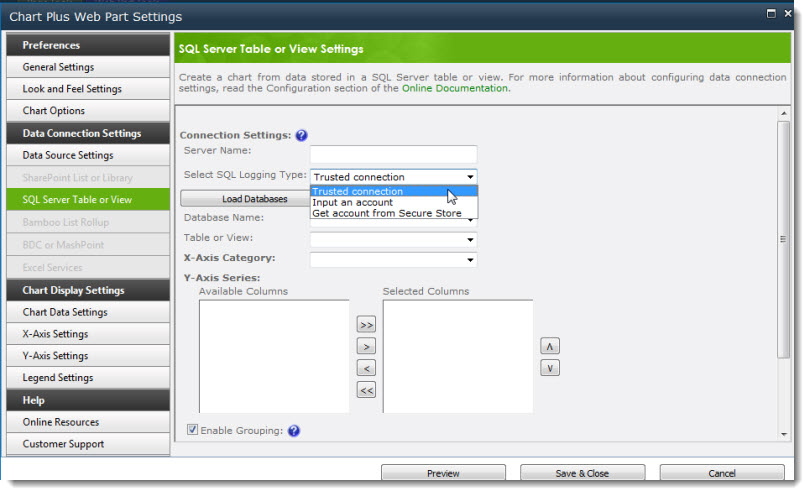 |