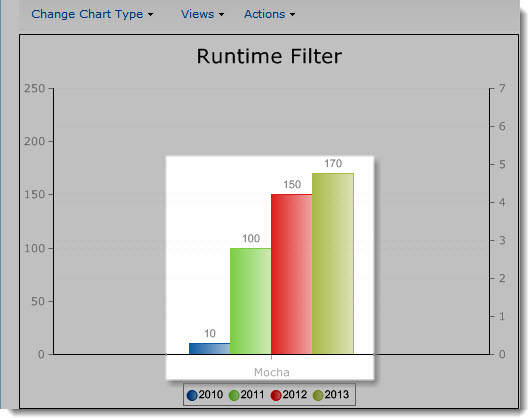
 Here is an example of a chart that is filtered by the selected Mocha view.
Selecting and displaying the right data that will most effectively communicate your message is an important part of the chart creation process.
Different audiences may require a view with all data or a view with a subset of data.
If you are using a SharePoint list or library to create a chart in Chart Plus 3.5 for SharePoint 2010, then the new Runtime Filter View option will give you the ability to dynamically filter and display data using the** Views** drop-down menu.
The Runtime Filter Option is not enabled by default, but can be enabled from the Chart Plus settings screen.
| Step | Action | Result |
| 1. | Select SharePoint List or Library Settings and check the Runtime Filter View option. For more information on how to edit the Chart Plus, see Configuring Chart Plus. | 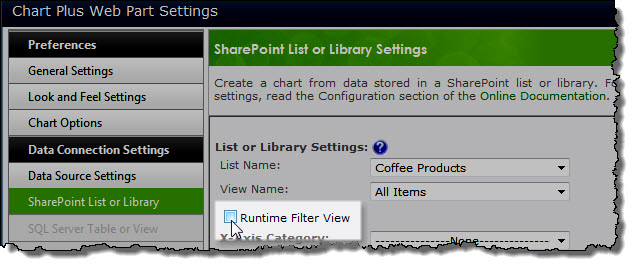 |
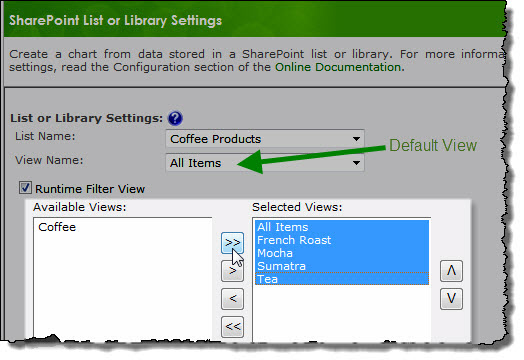
| 2. | Select the views from Available Views and use the > or >> buttons to add them to Selected Views. You must select views to make them available for the Runtime Filter View. |
|
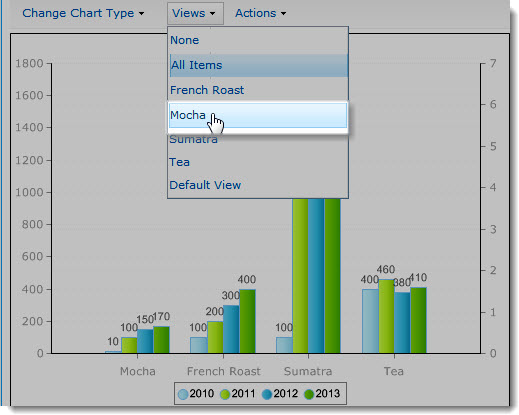
| 3. | To use the Runtime Filter View in a chart, select a view from the Views drop-down list. |
|