If you are using a SharePoint list or library to create a chart in Chart Plus 3.5 for SharePoint 2010, then the new Web Part Connections option will give you the ability to dynamically filter and display data.
Filter to display a subset of data.
| Step | Action |
| 1. | The filter Web Part provides a value. |
| 2. | The filter value is passed to a column in the List View Web Part by using a Web Part connection. |
| 3. |
The List View Web Part displays only those columns that match the filter value.
|
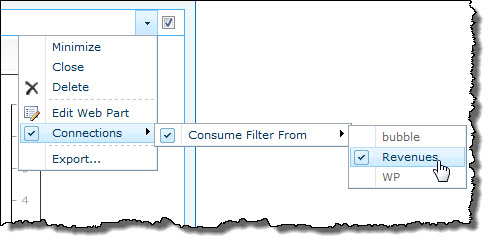
| 4. | In this example, we use a standard SharePoint list called Revenues list and connect this list using Chart Plus connection as shown below. From the Chart Plus drop-down list, select Connections > Consume Filter From > and select the list name.
|
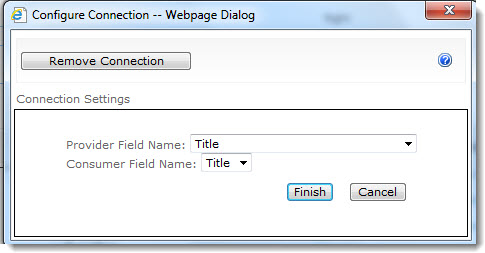
| 5. | Select a field from the Provider Field Name drop-down list. |
| 6. | Select a field from the Consumer Field Name drop-down list. |
| 7. | Click the Finish button.
|
| 8. |
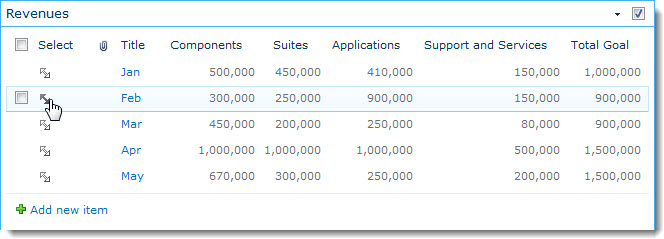
Once your List View Web Part is added to the page where Chart Plus is located, you can dynamically filter based on the selected view. Click on the arrow to select a view. Once a view is selected in the list, the arrow will be bold. To deselect an item, click on another view.
|
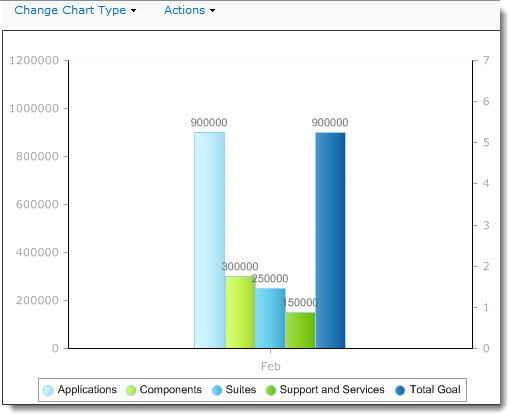
Here is an example of a chart that is filtered by the Feb view.