 Selecting and displaying the right data that will most effectively communicate your message is an important part of the chart creation process. Different audiences may require a view with all data or a view with a subset of data.
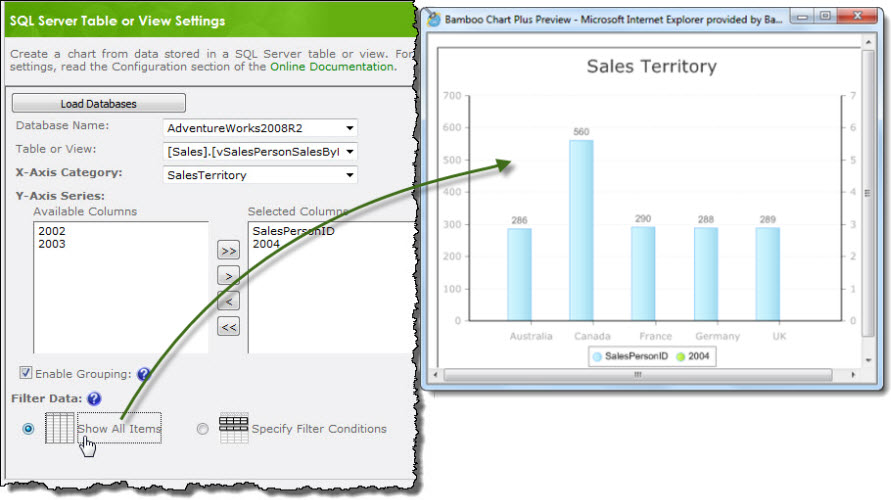
If you are using a SQL Server Table or View to create a Chart in Chart Plus 3.5 for SharePoint 2010, then the new Filter Data option will give you the ability to filter and display data by applying filter criteria.
The Filter Data option allows you to show all items in the data set by selecting Show All Items or display a subset of items by selecting Specify Filter Conditions.
| Step | Action | Result |
| 1. |
To enter filter criteria, click the Specify Filter Conditions radio button.
|
|
| 2. | Select an operator from the options in the Operator drop-down list. | |
| 3. | Enter a Value to be applied against the selected Field Name. | |
| 4. | Select an operator from the options in the Joining Operator drop-down list if you want to apply additional filter conditions. | 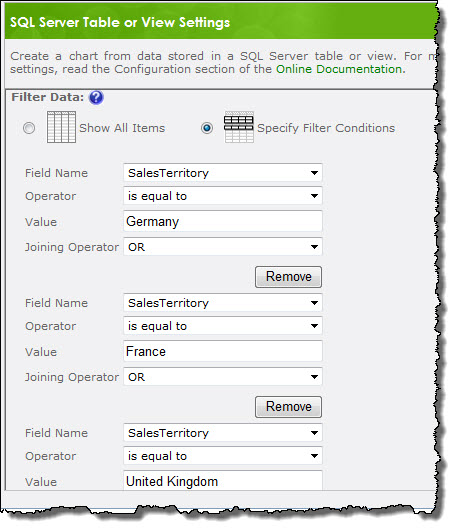 |
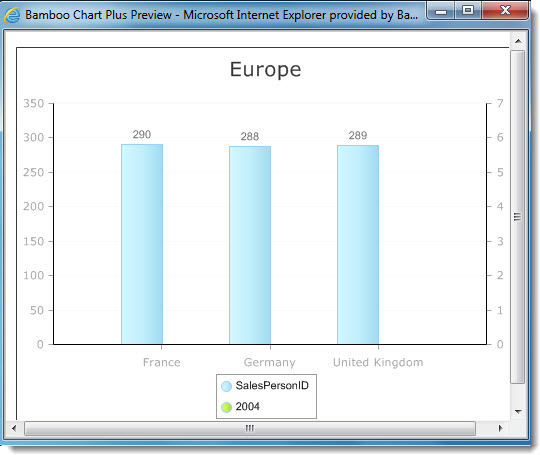
 In this example, the applied filter criteria shown above displays data for the Europe sales territory.