Changing the Y-Axis in Chart Plus
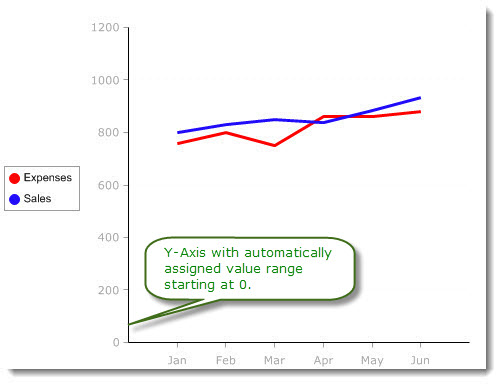
When you create a chart using Chart Plus, the vertical Y-Axis will start at 0 and display a value range automatically determined by the data set. In many instances the automatically defined value range of the Y-Axis is adequate for the data being displayed, however, there may be occasions when you want to modify that range to help communicate the desired message.
The Line chart below was created with a value range (0-1200) determined by the data set.
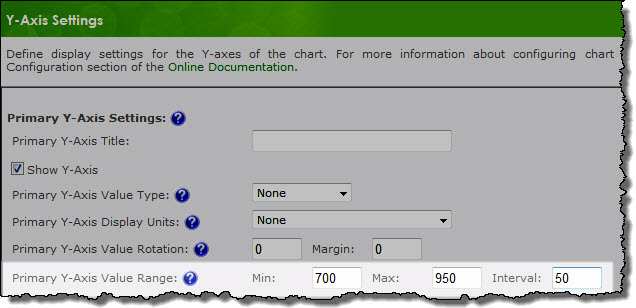
In Chart Plus 3.0 and higher, you have the ability to customize the value range of the Y axis from the Y-Axis Settings configuration screen. To enter custom values for the Primary or Secondary Y-Axis, specify the Minimum and Maximum values for the axis and the desired interval between grid lines.
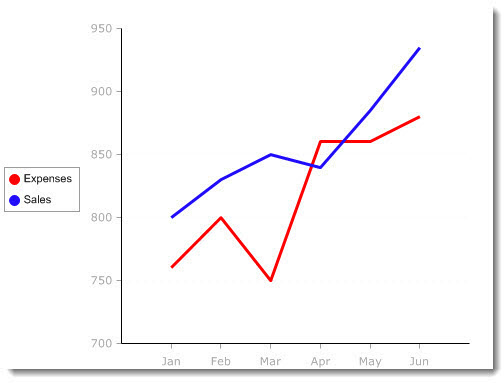
By changing the Y-Axis Value Range, the chart area is used more effectively, revealing more about the fluctuations in trend lines, and the relationship between the variables.