 Selecting the chart type that will most effectively communicate your message is an important part of the chart creation process. Each chart type will emphasize a different aspect of the data, which could provide different insights.
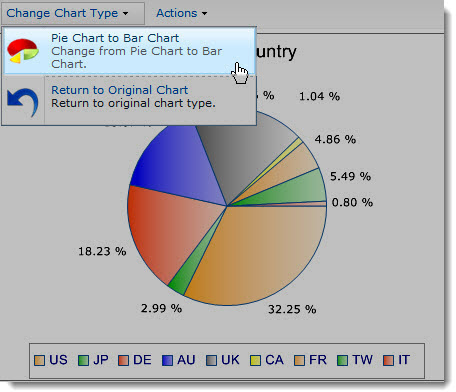
The Change Chart Type menu allows you to dynamically change chart type without having to edit the Web Part settings. If the Allow dynamic chart type change option is enabled in the Chart Options preferences, then the Change Chart Type menu will be available in the Web Part tool bar.
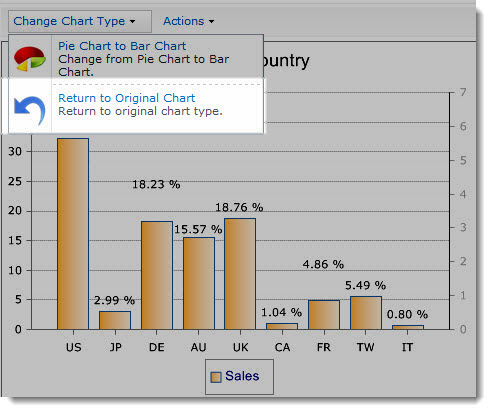 If you are working with a single data series and create a Pie chart or a Line chart in Chart Plus 3.0 and higher, then the Change Chart Type option will give you the ability to dynamically view the same data set in a Bar chart. To switch back to the original chart type, use the Return to Original Chart option.
While the color coding applied to the original chart will not be maintained in the newly created pie or line chart, your audience will have a different way to analyze and interpret the data and even use the same Change Chart Type controls to revert back to the original configuration.
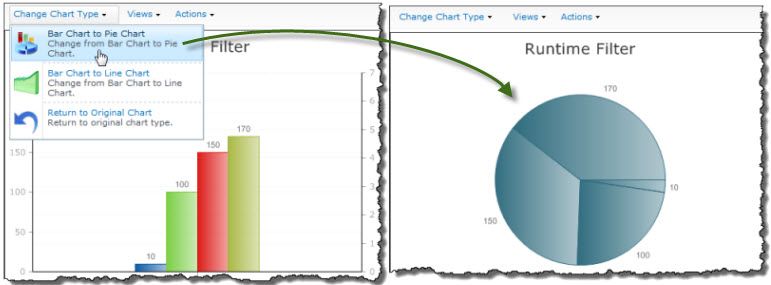 If you are working with a single data series and create a Bar chart in Chart Plus 3.5 for SharePoint 2010, then the Change Chart Type option will give you the ability to dynamically view the same data set in a Pie chart or a Line chart. To switch back to the original chart type, use the Return to Original Chart option.
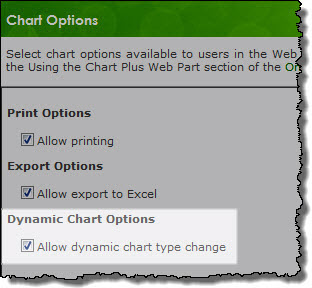 These Dynamic Chart Options are enabled by default, but can be disabled from the Chart Options configuration screen.