| Overview of Workflow Conductor Web Parts |
|---|
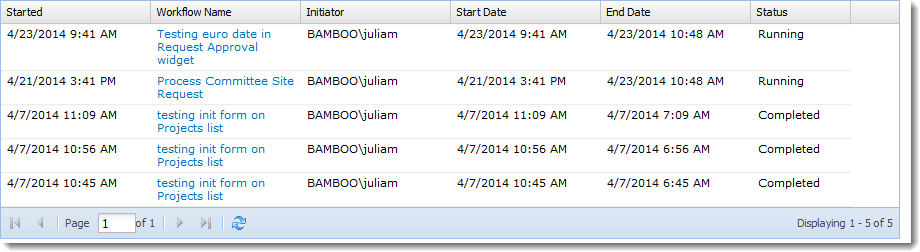
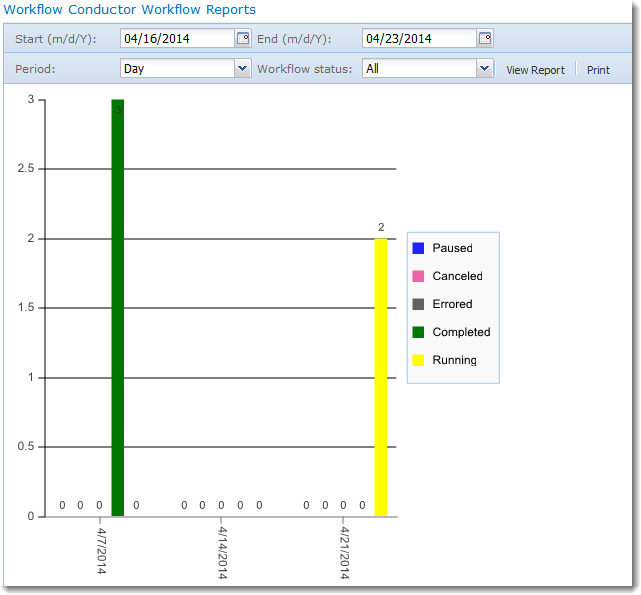 The Workflow Reports Web Part allows you to create reports about workflows in the current site or site collection. The report is displayed graphically, with a summary text-based list below the chart.
It is possible to specify the range of information you wish to display in the chart. Choose:
- Start Date – the start of the reporting interval
- End Date – the end of the reporting interval
- Period – Summarize the data by period. Choose Day, Week, Month, or Quarter.
- Workflow Status – choose All, Running, Completed, Errored, Canceled, or Paused.
When ready, click View Report. If desired, choose to print the report by click Print. The print includes the graph, but not the list display beneath the chart.
For information about the configuration parameters for this web part, see How to Configure the Workflow Reports Web Part