Poll results can be displayed on a bar graph or pie chart. To choose how the results will be displayed, follow these steps:
| Step | Action | Result |
| 1. | Edit Poll as described in the Configuring section. | |
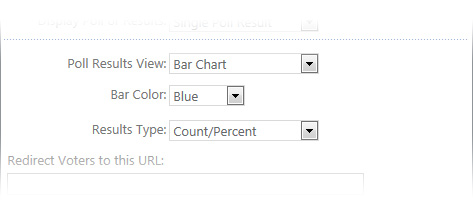
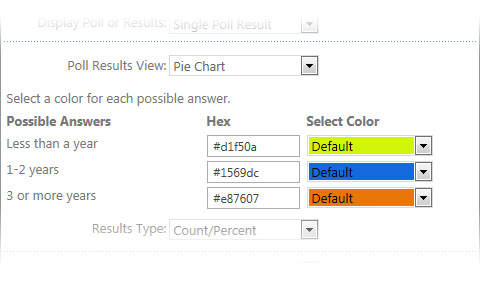
| 2. | The Bamboo Poll Voting tool pane is displayed on the right side of the screen. In the tool pane under Poll Results View, choose Bar Chart or Pie Chart for the type of chart. | |
| 3. | Depending on the selected type of chart, follow these steps: |
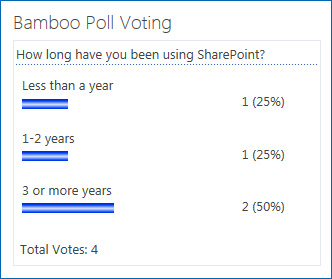
If you selected Bar Chart:
|
| 4. | Click Apply and OK to save your changes. | |