| KBSA Configuration Overview |
|---|

When you open the link for Reporting, you see a page with four tabs across the top. The first tab is the Article Counts by Categories displaying a box containing the categories and a data view at the bottom of the page.
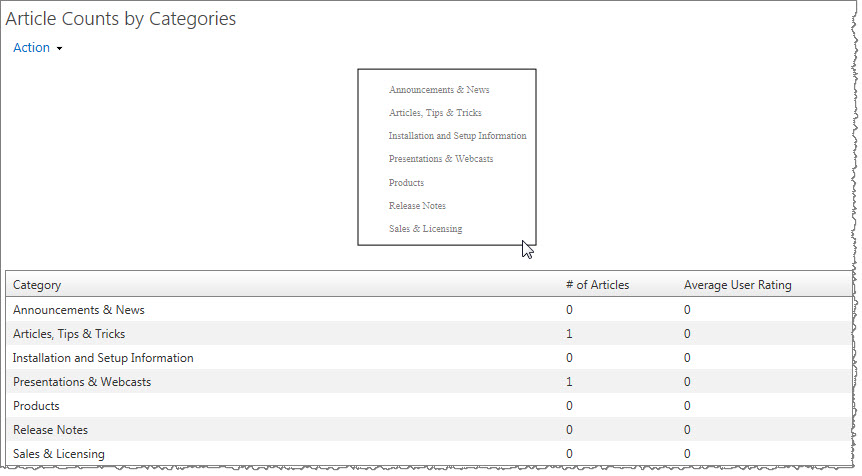 A data view is displayed underneath Article Counts by Categories and Article Counts by Article Type. This data view displays the number of articles in each category or article type as well as the average user rating for that category or article type.
You can modify the web part so that each of your categories has a color corresponding to it so that the plain chart becomes a bit more colorful to look at.
To select colors for the chart, edit the Web Part to open the tool pane where you can configure the category color options.
| Step | Action | Result |
| 1. | In the tool pane, click the button Choose colors for the chart. In SharePoint 2013, the button reads “Edit colors.” | 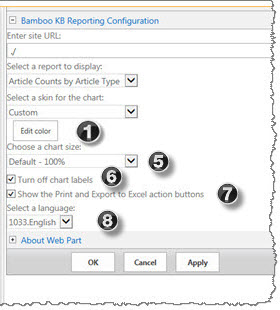 A new window opens where you can select the desired colors for the chart. |
| 2. | You have the option to click the Auto Select button to automatically assign colors. | 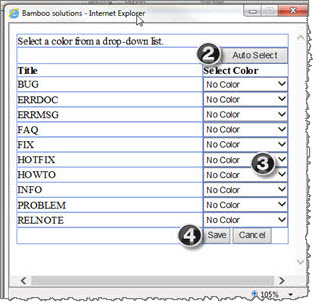 |
| 3. | Or you can choose your colors individually using the drop-down arrows next to each category to set the color for that category. | |
| 4. | Click Save to save your choices. | The chart containing categories will update with the colors that you picked.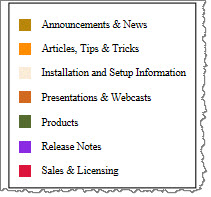 |
See also: