Many companies are implementing SharePoint for the sole purpose of handling their project management at all levels within their business. While SharePoint out-of-the-box provides quite a bit of functionality to accomplish this goal, it is lacking in its ability to provide project progress measurement. For enterprise MOSS 2007, SharePoint 2010, SharePoint 2013 owners, you can purchase a reporting pack and even purchase MS Project for the enterprise to handle this, but for many companies this is time and cost prohibitive.
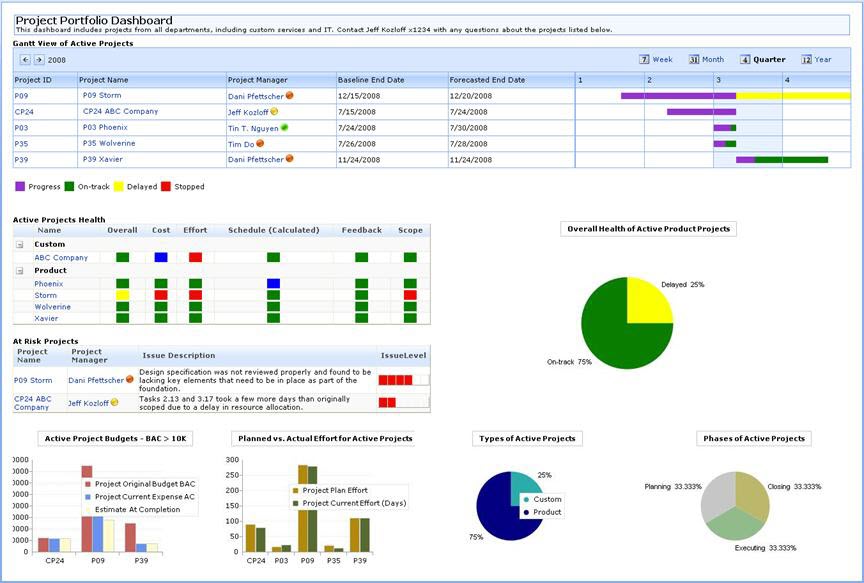
The SharePoint Project Portfolio Dashboard provides you with a single view of the progress, health and risk level of the projects in your entire project portfolio. Project Managers can communicate the status of the effort, cost and budget for each project using configurable red/yellow/green indicators, issues meter, bar or pie chart and Gantt view widgets. You can use one or all of these widgets to display your project data in the dashboard as well as the layout for how the widgets are displayed.
Bamboo’s SharePoint Project Portfolio Dashboard is one Web Part that is made up of multiple, customizable widgets. Each widget provides measurement of project progress from various perspectives, including budget, schedule, risk, and overall health. You can show only the widgets that make sense for your project management needs.
The widgets you can choose from are:
| Widget | Type | Description |
| Gantt View of Active Projects | Gantt/Progress Bar | Displays a Gantt View with a color-coded progress bar for each project. |
| Active Projects Budget | Bar Chart | Shows the Project Original Budget (BAC) vs. Project Current Expense (AC) vs. Estimate at Completion (EAC) in a bar graph. |
| Active Projects Health View | Gantt/Progress Bar | Displays a Gantt View with a color-coded progress bar for each project. |
| Gantt View of Active Projects | Red/Yellow/Green Indicator List | Show the health of your projects in 6 typical tracking categories (i.e. Overall, Cost, Effort, Schedule, Feedback, Scope) using red/yellow/green indicators. |
| Active Projects Health View (Calculated) | Red/Yellow/Green Indicator List | Show the health of your projects in 6 typical tracking categories (i.e. Overall, Cost, Effort, Schedule, Feedback, Scope) using red/yellow/green indicators. The Schedule and Cost categories can be calculated instead of manually indicated. |
| Types of Active Projects | Pie Chart | Displays the percentage of projects in each category. You can custom categorize your projects to communicate which department has primary responsibility (i.e. Product, Custom, Marketing, etc.) |
| Phases of Active Projects | Pie Chart | Shows the percentage of projects in each phase of the Project lifecycle (i.e. Initiating, Planning, Execution, Controlling, or Closing). |
| Overall Health of Active Projects | Pie Chart | Displays the percentage of projects in each of the health statuses of On-track, Delayed, or Stopped. |
| At Risk Projects | Issues Meter | Configurable list that displays a red bar meter indicating the degree of risk for specific projects. |
All the project data that supplies these widgets is stored in the Project Dashboard List which is automatically installed on the site when you add the Bamboo Project Portfolio Dashboard to a page on the same site.
You can also configure the placement of these widgets inside the Web Part by editing the Web Part’s HTML source code directly. Each widget that you want to show can be configured in the tool pane of the Bamboo Project Portfolio Dashboard. Your SharePoint Project Portfolio Dashboard could look like this: