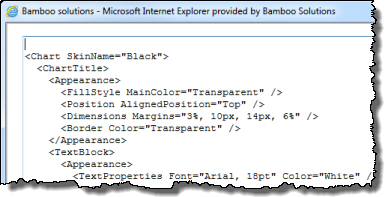
 If you can’t find something you like in the pre-defined Chart Skins, you can create your own CSS using the Style Sheet tool. Select Custom Settings and click the Edit button to create a custom style sheet.
Tip: To customize an existing Chart Skin, select the skin first. When you click the Edit button, the settings for that skin are pre-populated in the edit screen.
If you create a custom CSS and then select a new Chart Skin later, your CSS will be overwritten with the new skin.
NOTE: Series colors cannot be defined in the custom Style Sheet. Use the Series Palette option or select custom series colors in the Chart Data Settings.
See also:
