Funnel charts compare the count or sum of a y-axis number across several x-axis categories, usually stages of a process. A funnel chart requires an x-axis category and one y-axis data series.
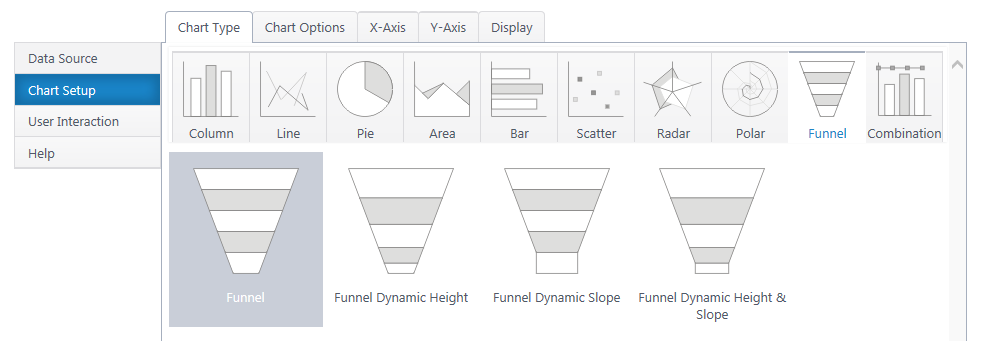
Dynamic height funnels adjust the height of the funnel segments to their percentage of the total funnel volume. The dynamic slope adjust the angle of each funnel segment depending on the ratio of the current and next value.
If you haven’t yet, **select a data source.(http://bamboo.docfactory.com/ChartPlus_(holding/Create_a_New_Chart?go=data
As you’re building your chart, use the Preview button in the upper right to check your work in progress.
Chart Options (Choose X & Y Axis)
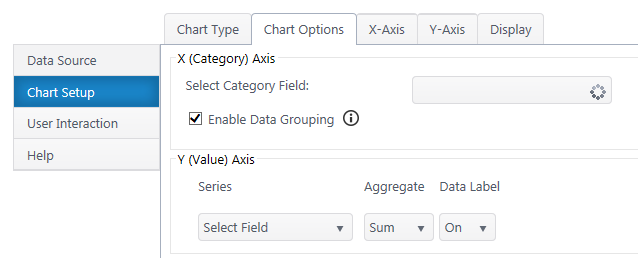
X (Category) Axis
Select Category Axis – Select which column of categories you would like to compare. The dropdown list will auto-populate with columns from your data source. Date/time types are not available.
Enable Data Grouping – Group x values of the same category. Typically, you want grouping enabled. If off, each individual data point will be a separate funnel segment.
Y (Value) Axis
Series – Specify what value you would like to compare between the categories. Add additional y-axis series to compare.
Aggregate – If you have enabled grouping on the x-axis, aggregate the y-axis data you are comparing (sum, first, min, max, average, count). By default, chart plus compares the sum of y values.
Data Label – Toggle data labels for each Y series.
X-Axis Configuration
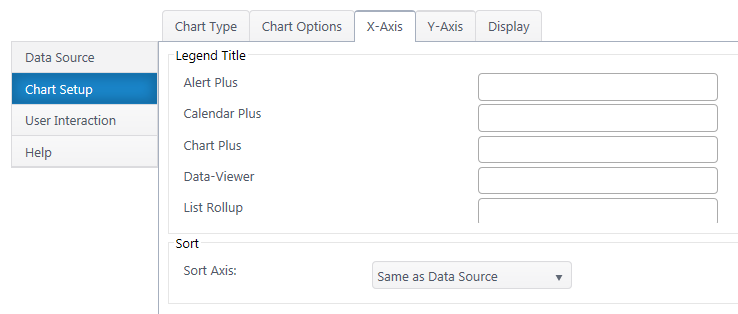
Legend Title
Legend Title – Specify custom text you would like to appear in the legend for each category.
Sort
Sort Axis – Specify an ascending or descending sort order for how categories display on the x-axis.
Y-Axis Configuration
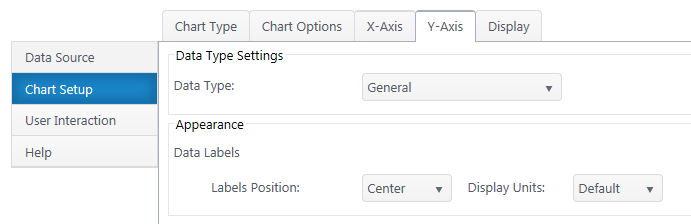
Data Type Settings
Data Type – Select a data type for y values (general, number, currency, date, time, percentage, scientific).
Format – Configure details on how Y values will display on the axis and labels. Date types also require you to select the date scale for the y-axis.
Appearance
Y-Axis Labels – Toggle y-axis labels and their display angle & position.
Next: **Configure the Chart Display Settings**(http://bamboo.docfactory.com/ChartPlus_(holding/Create_a_New_Chart?go=display