| Return to Configuration Overview |
|---|
Often the data that you want to map may fall into several categories and you want the marker for each location to represent the category. This is supported with the Virtual Map View Web Part.
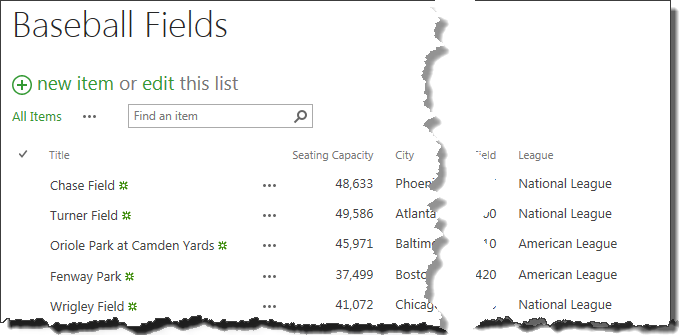 As an example for these instructions, consider a SharePoint list that stores information about baseball fields in the USA.
You want to display National League parks with one marker type ( ) and American League parks with another (
 ).
).
Follow these steps to configure your map with multiple markers:
| Step | Action |
|---|---|
| 1. |
A selection list will appear next to the Use Multiple Markers box; it contains all the columns from the selected Data Source. Select the column from the data source that stores the value to determine the marker type to use. In our example using the Baseball Fields list, this column is League. |
| 2. |
Next, you need to specify which marker to user for each value of the Use Multiple Markers column selected in Step 1 above. If you want to use custom markers, create them first.
For each Marker that you want to display on the map, edit the associated tag to update the MarkerType value. MarkerType should equal the value of the Use Multiple Markers column that is associated with that marker. In our Baseball Fields example, the Use Multiple Markers column is League. The League column is set to either American League or National League for each baseball park in the list. For this baseball field example, we created two custom markers, one called NL for National League and the other called AL, for American League. After updating the MarkerType value for each, the tags for those two markers look like this: When edits are complete, click Save to save changes and close the edit window. Otherwise, click Cancel to close the window without saving any changes. |
| 3. | After clicking Apply and then OK in the tool pane, a portion of the configured map will look like this: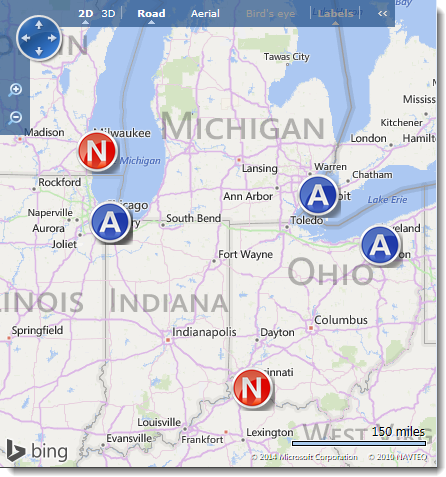 |
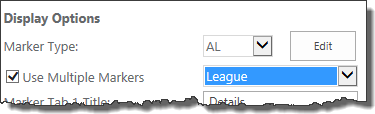 In the tool pane of the Virtual Map View, check the Use Multiple Markers box to use multiple marker types to denote different types of data (i.e., one marker for American League baseball parks and another marker for National League parks).
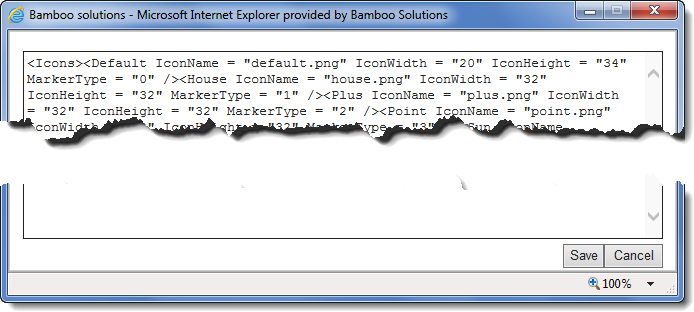 Click the Edit button next to the Marker Type field. An edit window appears.
| Return to Configuration Overview |
|---|
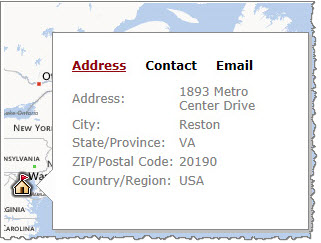
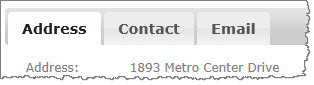
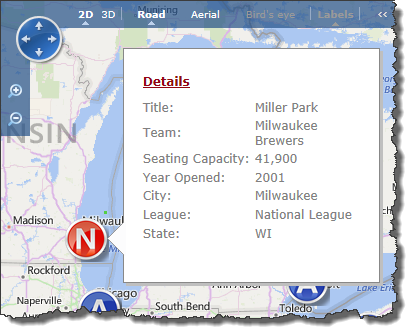 The Marker Tabs appear when a marker on the map is clicked. An example with two tabs (General and Stats) configured is shown here.
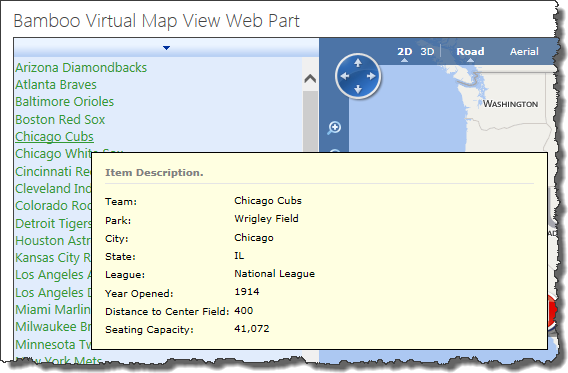 Another pop-up display, called Item Description, appears when the end user hovers over the list of items on the left side of the Virtual Map View display. An example is shown here.
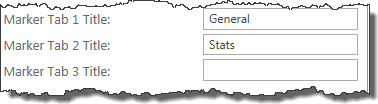 In the Virtual Map View tool pane, decide how many tabs you want to use. Enter a Title for each.
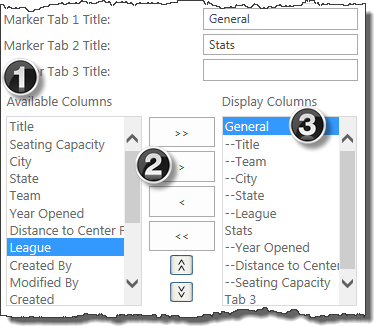 Next, decide what column values from the list to display on each tab.
 ) or down (
 ) arrow. The highlighted column will move one position.
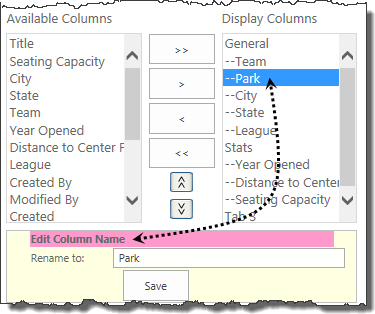 Rename a displayed column. Sometimes the actual column name may be too long or not descriptive. Rather than displaying the actual name of the column, it is possible to use a column alias for display in the marker tab on the map.
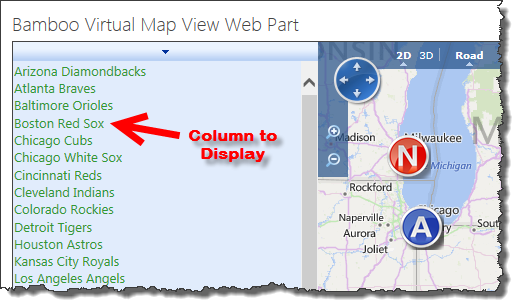

 Displaying icons in pages may speed you page load times since only the items in the first page are loaded initially.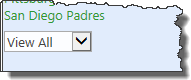
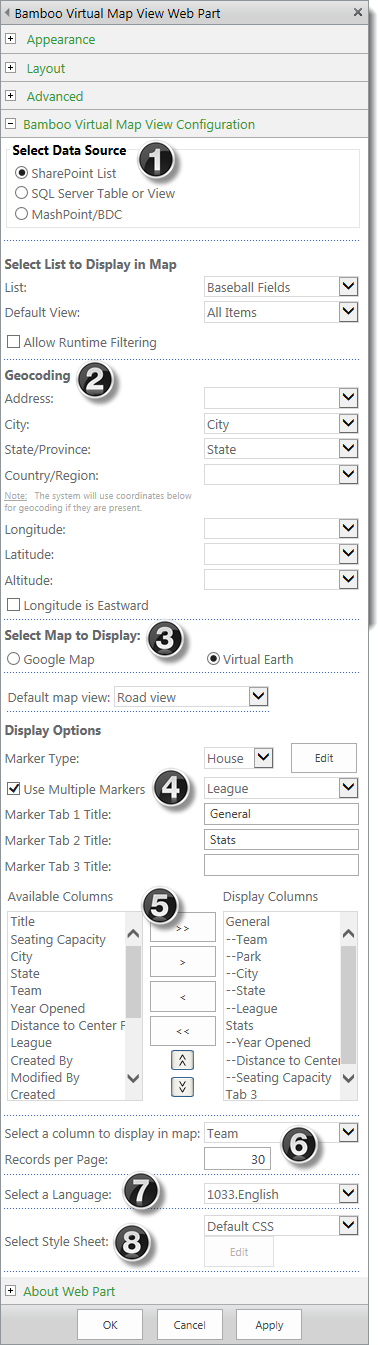 Configuring Virtual Map View offers a variety of options from the type of data source to the type of maps and markers to display.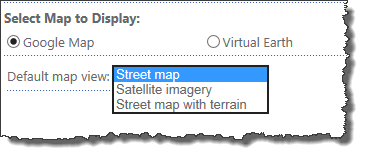
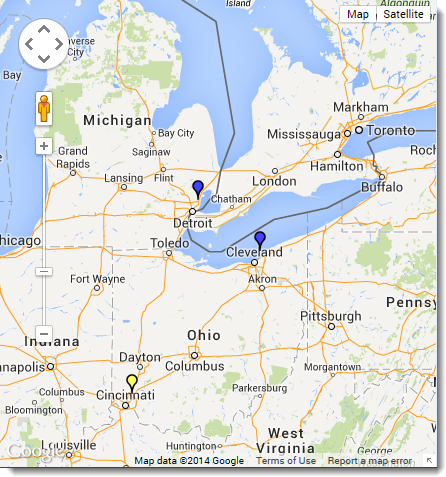
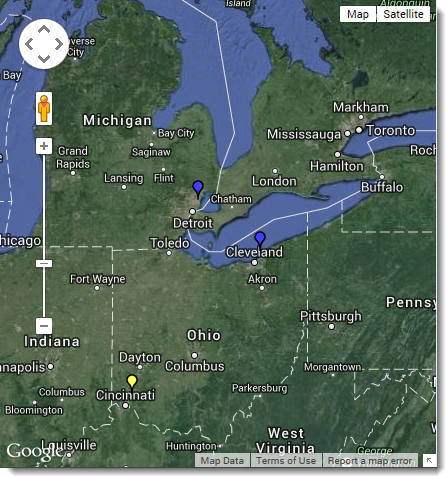
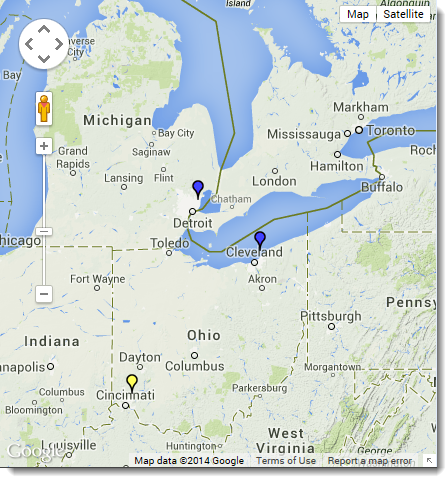
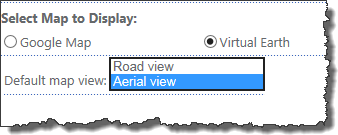
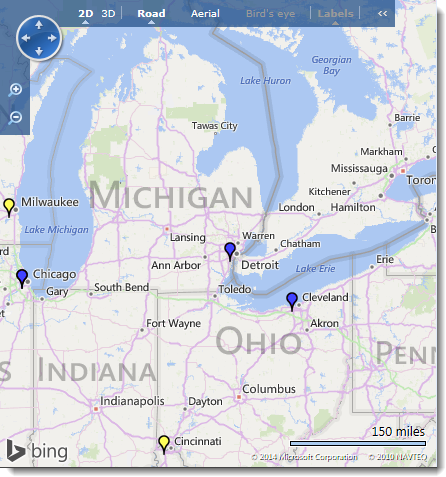
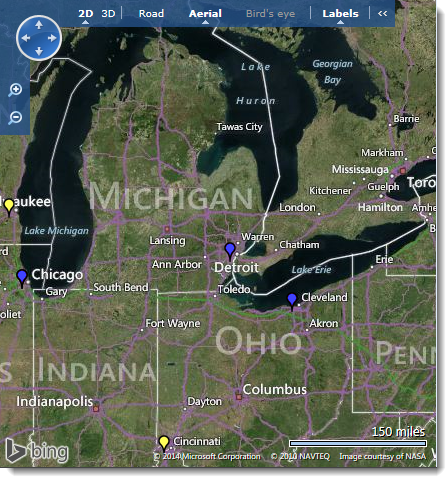
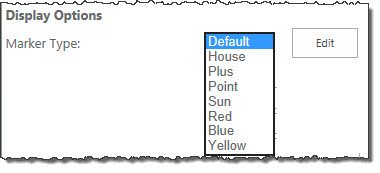



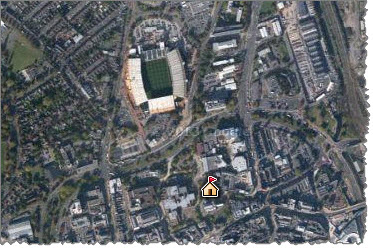
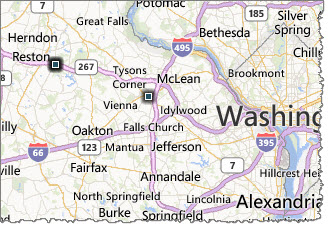
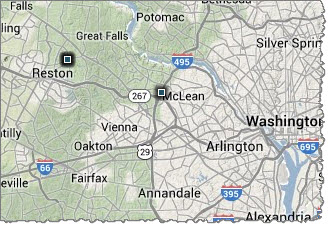
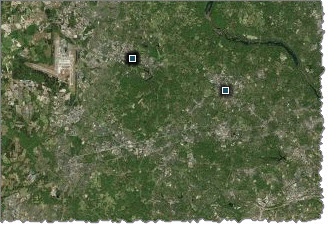
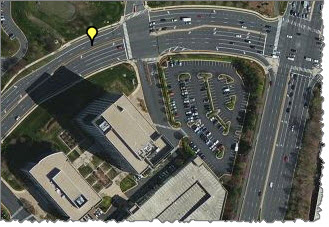
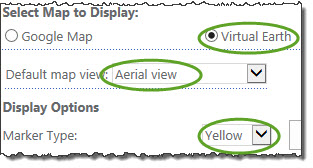

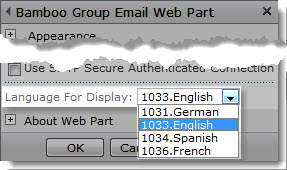
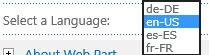
 IMPORTANT: If you do not rename the files you modify, your customizations will be overwritten when you upgrade to a new Bamboo product release.
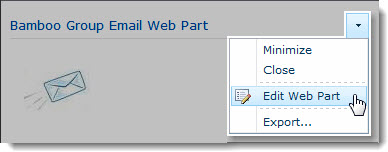 Click the edit drop-down menu on the Web Part title bar and select Edit Web Part (or Modify Shared Web Part if you are using SharePoint 2007). See the example from the Group Email Web Part.
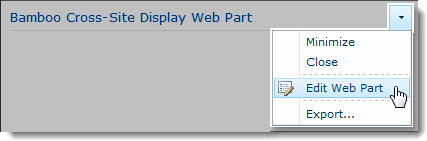 Click the edit drop-down menu on the Web Part title bar and select Edit Web Part (or Modify Shared Web Part if you are using SharePoint 2007).
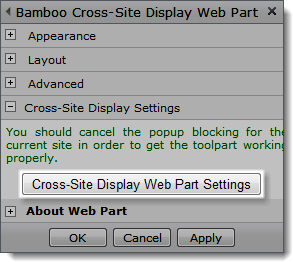 Click the [Product] Settings button in the Web Part tool pane.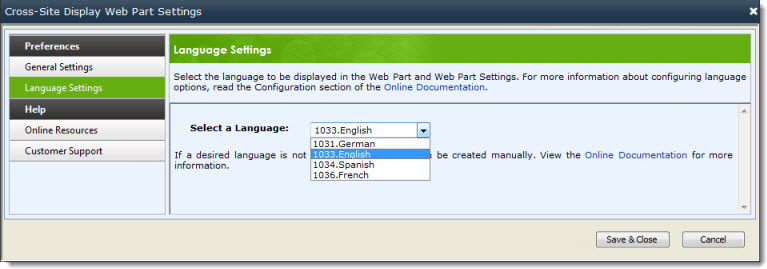
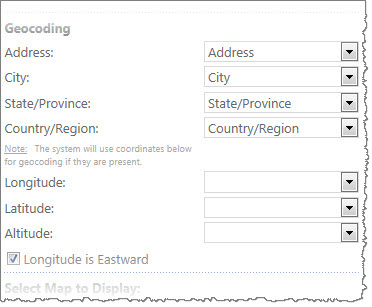 Regardless of your data source, select the columns for Address, City, State/Province, and Country/Region. If your data already contains geographic coordinates, select the columns that contain Latitude, Longitude, and optionally, Altitude.
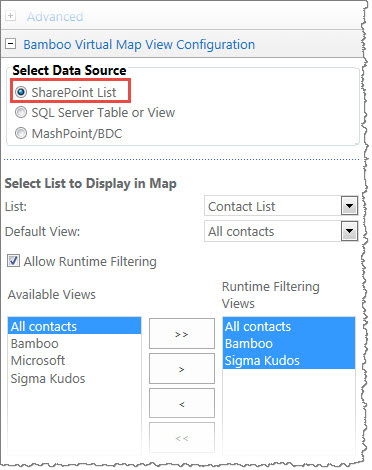 Select this option to access the available SharePoint lists/libraries on the current site.
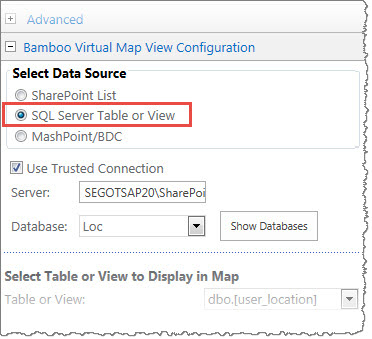 Select this option to indicate whether or not to use a SQL Server Table or View
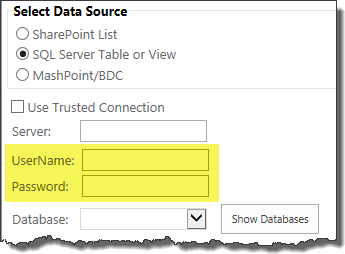 If you want to use a database located on another server, and thus, will not use a trusted connection, additional configuration parameters will appear:
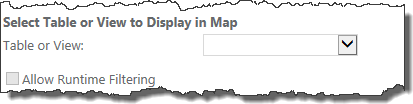 In the Select Table or View to Display in Map section of the tool pane, choose the Table or View that contains the data to be displayed on the map.
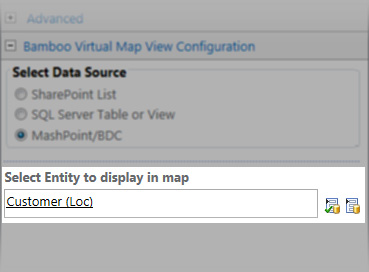 Select this option to access databases, web services or Custom Providers through Bamboo MashPoint or with a source configured via Microsoft Business Data Catalog (BDC).
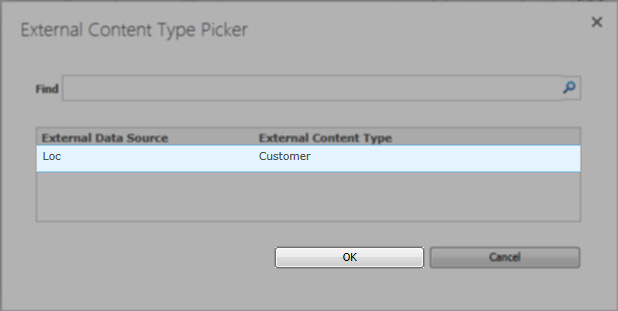 To select the entity from the available content types, click on the Select External Content Type icon (
 ) to open the External Content Type Picker window where you can find the external data source with the data to display on the map. Select the appropriate one and click OK to close the window.
 ) to make sure you entered it correctly.
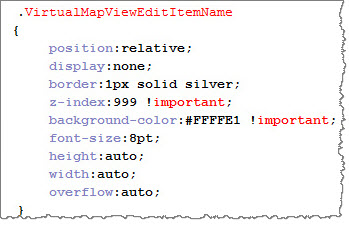
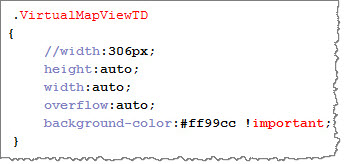
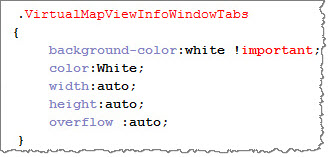
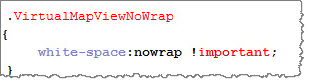
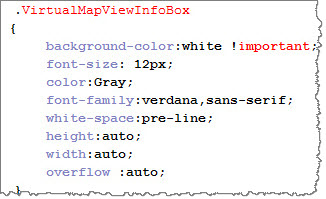
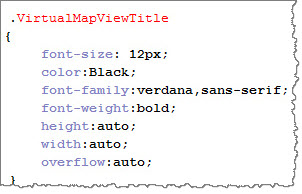
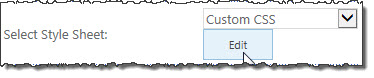 To access the style sheet editing option in the tool pane, select Custom CSS from the Select a Style Sheet drop-down button, and then click Edit. The style sheet editor opens.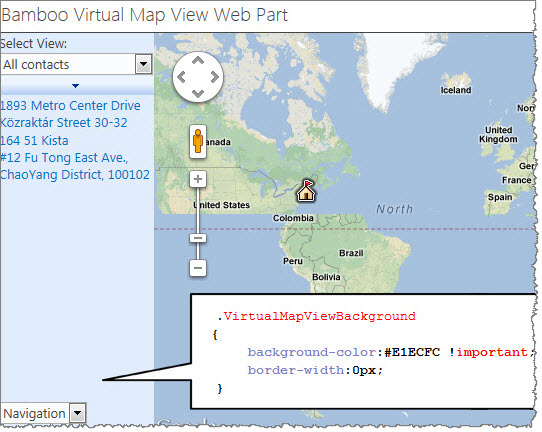
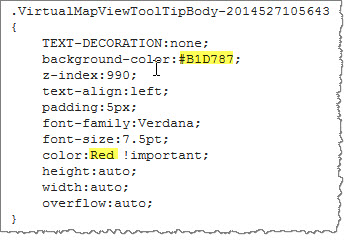
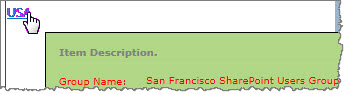
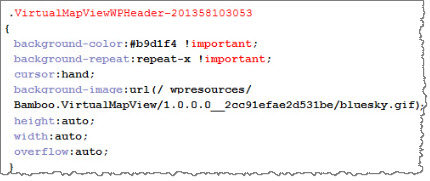
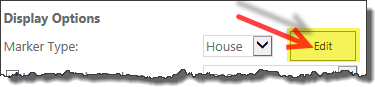 In the web part tool pane, click Edit next to the Marker Type selection. A window will appear where you can edit information about the available marker types.
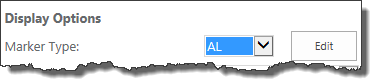 Once the tag for your custom marker is saved, it will be available in the Marker Type selection list. Select it in order to see it displayed on your map.